Team:TU Delft/Project/sensing/results
From 2010.igem.org
(→BBa_K398326) |
(→BBa_K398326) |
||
| Line 19: | Line 19: | ||
[[Image:TU_Delft_pCaiF_final2.jpg]] | [[Image:TU_Delft_pCaiF_final2.jpg]] | ||
| + | |||
| + | |||
| + | <style type="text/css"> | ||
| + | table.tableizer-table {border: 1px solid #CCC; font-family: Arial, Helvetica, sans-serif; font-size: 12px;} .tableizer-table td {padding: 4px; margin: 3px; border: 1px solid #ccc;} | ||
| + | .tableizer-table th {background-color: #104E8B; color: #FFF; font-weight: bold;} | ||
| + | </style> | ||
| + | |||
| + | <table class="tableizer-table"> | ||
| + | <tr class="tableizer-firstrow"><th>Condition</th><th>Exponential phase [RiPS/O.D.] </th><th>Stationary phase [RiPS/O.D.]</th></tr> <tr><td> </td><td> </td><td> </td></tr> <tr><td>LB</td><td>1.2516E+07</td><td>-8.6245E+05</td></tr> <tr><td>0.5LB</td><td>1.8101E+07</td><td>-2.5945E+05</td></tr> <tr><td>10g/L</td><td>6.6456E+06</td><td>-6.7109E+06</td></tr> <tr><td>5g/L</td><td>8.3673E+06</td><td>4.2339E+06</td></tr> <tr><td>2g/L</td><td>7.2869E+06</td><td>3.9755E+07</td></tr> <tr><td>1g/L (glucose)</td><td>7.4517E+06</td><td>2.1543E+07</td></tr> <tr><td>1g/L (Laurate)</td><td>1.1435E+07</td><td>6.6428E+06</td></tr></table> | ||
| + | |||
| Line 30: | Line 40: | ||
View [http://partsregistry.org/wiki/index.php?title=Part:BBa_K398326 BBa_K398326 in the '''parts registry'''] | View [http://partsregistry.org/wiki/index.php?title=Part:BBa_K398326 BBa_K398326 in the '''parts registry'''] | ||
| - | |||
| - | |||
| - | |||
| - | |||
| - | |||
| - | |||
| - | |||
| - | |||
| - | |||
| - | |||
| - | |||
| - | |||
| - | |||
| - | |||
| - | |||
| - | |||
| - | |||
| - | |||
Revision as of 10:20, 27 October 2010

Sensing Results
pCaiF strength
[http://partsregistry.org/Part:BBa_K398326 BBa_K398326]
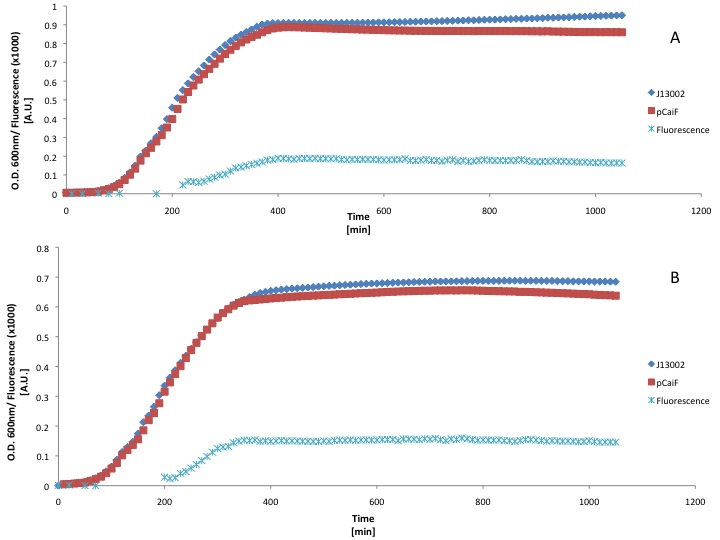
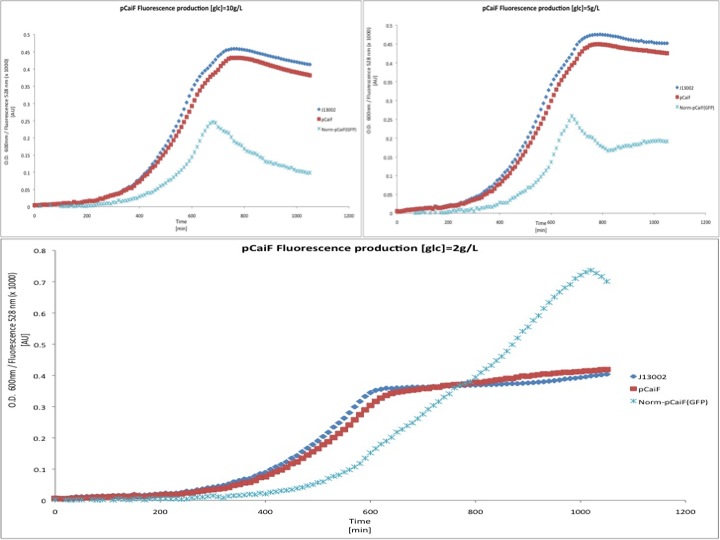
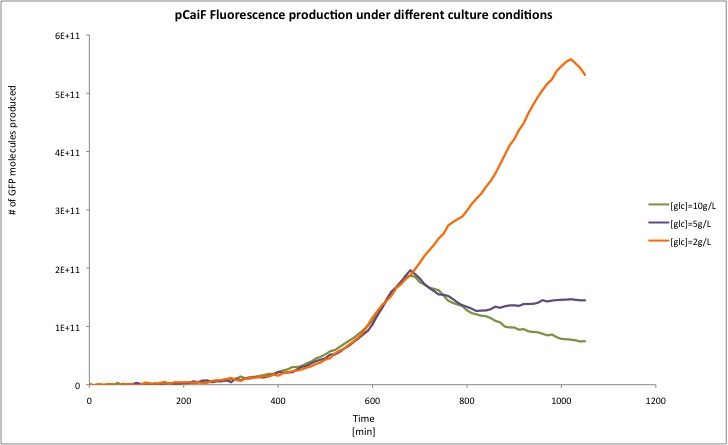
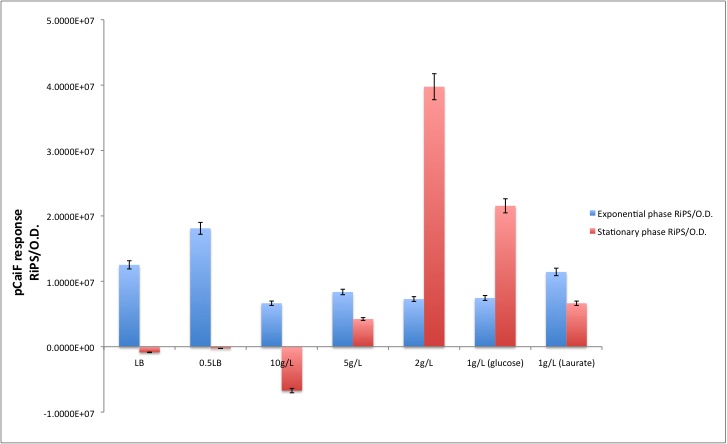
pCaiF is one of our Biobricks of the sensing project. It's function is to express proteins under glucose limitation conditions. In order to measure its strength we attached the GFP generator [http://partsregistry.org/Part:BBa_E0240 BBa_E0240] in front of this new promoter in order to know the response produced in the different growth phases.
Our results are shown in the following plots:
<style type="text/css">
table.tableizer-table {border: 1px solid #CCC; font-family: Arial, Helvetica, sans-serif; font-size: 12px;} .tableizer-table td {padding: 4px; margin: 3px; border: 1px solid #ccc;}
.tableizer-table th {background-color: #104E8B; color: #FFF; font-weight: bold;}
</style>
| Condition | Exponential phase [RiPS/O.D.] | Stationary phase [RiPS/O.D.] |
|---|---|---|
| LB | 1.2516E+07 | -8.6245E+05 |
| 0.5LB | 1.8101E+07 | -2.5945E+05 |
| 10g/L | 6.6456E+06 | -6.7109E+06 |
| 5g/L | 8.3673E+06 | 4.2339E+06 |
| 2g/L | 7.2869E+06 | 3.9755E+07 |
| 1g/L (glucose) | 7.4517E+06 | 2.1543E+07 |
| 1g/L (Laurate) | 1.1435E+07 | 6.6428E+06 |
Different media, and carbon source concentrations were tested in order to obtain an insight about the protein production during starvation.
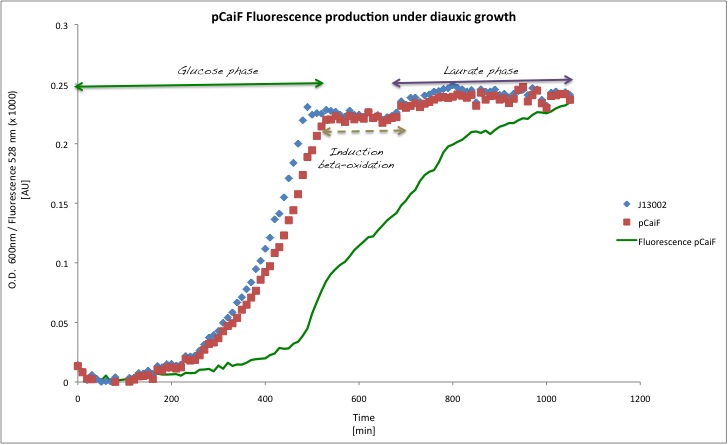
Also, it is well known that this promotor it's active during diauxic shifts, that's why we measured the GFP production using glucose as a first carbon source (concentration of 1g/L) and Potassium Laurate (5mM) as a secondary carbon source. The results that we got suggest that the part works like a charm! During glucose starvation high levels of cAMP can be found in cells, which enhances the expression of the proteins downstream of this promoter. On the other hand when the secondary carbon source is being catabolized by the cells, cAMP levels drop and thus the expression of genes regulated by pCaiF.
Surprisingly, we found a leaky production of GFP, however according to our treatment the GFP production during the exponential phase is lower than in the stationary phase, something expected due to the fact that the regulator of this system is the intracellular cAMP levels.
View [http://partsregistry.org/wiki/index.php?title=Part:BBa_K398326 BBa_K398326 in the parts registry]

 "
"
