Team:Toronto/Results
From 2010.igem.org
| Line 26: | Line 26: | ||
<p> | <p> | ||
| - | A | + | '''A''' |
[[Image:Toronto-LB-Plate_1.jpg|400px]] [[Image:Toronto-LB-Plate_2.jpg|400px]] | [[Image:Toronto-LB-Plate_1.jpg|400px]] [[Image:Toronto-LB-Plate_2.jpg|400px]] | ||
</p> | </p> | ||
<p> | <p> | ||
| - | B[[Image:Toronto-results-catechol_tolerance.png|center]] | + | '''B'''[[Image:Toronto-results-catechol_tolerance.png|center]] |
</p> | </p> | ||
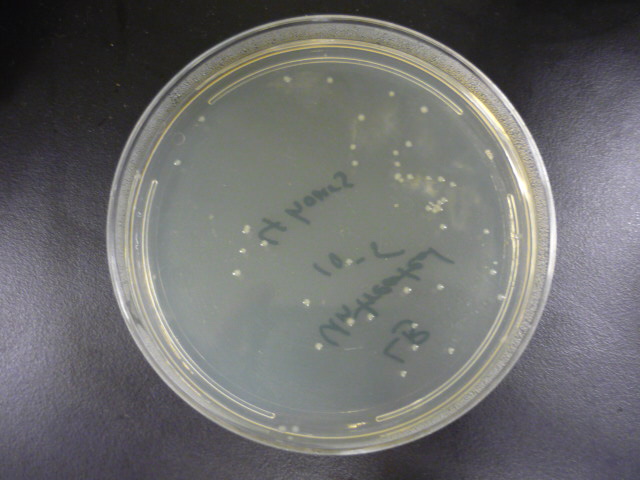
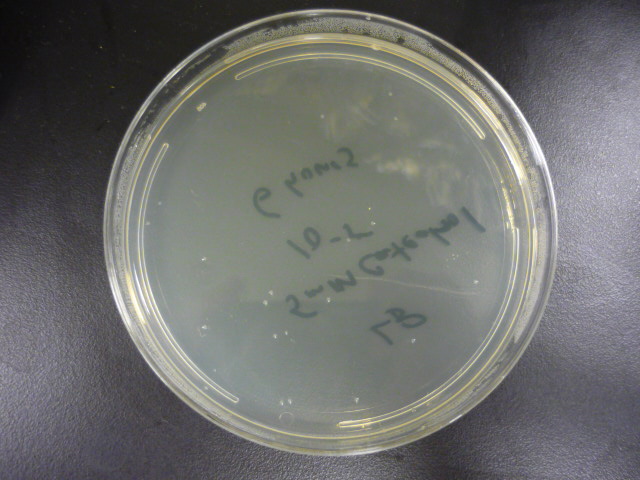
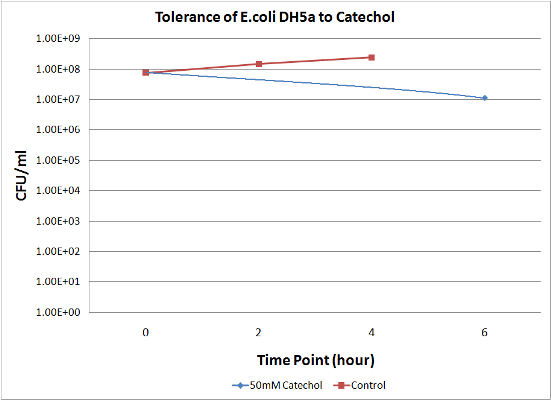
<blockquote>'''Figure 1:''' A. Growth of ''E.coli'' DH5a on LB plates (1x10<sup>-5</sup> dilution) following exposure to minimal media and minimal media with 50mM catechol in solution. Plates shown are for the last time points plotted. B. Survival curves of ''E. coli'' DH5a exposed to catechol over a six hour time course.</blockquote> | <blockquote>'''Figure 1:''' A. Growth of ''E.coli'' DH5a on LB plates (1x10<sup>-5</sup> dilution) following exposure to minimal media and minimal media with 50mM catechol in solution. Plates shown are for the last time points plotted. B. Survival curves of ''E. coli'' DH5a exposed to catechol over a six hour time course.</blockquote> | ||
Revision as of 16:43, 26 October 2010
| Home | Project | Design | Protocols | Notebook | Results | Parts Submitted to the Registry | Modeling | Software Used | Human Practices | Safety | Team | Official Team Profile | FAQ | Acknowledgments |
|---|
Results
E. coli DH5a is sensitive to Catechol exposure
To measure the effect of our pathway manipulations on the viability of E.coli exposed to catechol we plan to perform a tolerance test. In preliminary experiments we established the baseline sensitivity of E.coli (DH5a) exposed to 50mM catechol in liquid media over a six hour time course. Aliquots of this mixture were plated on LB media at various dilutions and colonies were counted and compared with untreated controls (see "Protocols"). There was no measurable difference between control and treated cells when bacteria were exposed to catechol in a growth media (data not shown). However, in minimal media (MM2) growth of control cells was moderate while exposed cells exhibited a marked decrease in survival (Figure 1). Although the effects of Catechol exposure in E.coli and P. putida have previously been investigated [Park et al. 2001] completion of these baseline experiments will enable us to determine the effect of pathway manipulations on the proposed engineered E.coli strains containing various configurations of the pathway.
B
Figure 1: A. Growth of E.coli DH5a on LB plates (1x10⁻⁵ dilution) following exposure to minimal media and minimal media with 50mM catechol in solution. Plates shown are for the last time points plotted. B. Survival curves of E. coli DH5a exposed to catechol over a six hour time course.
Synthetic construction of a functioning catechol ortho degradation pathway in E.coli is predicted to increase cell growth rate
Justification and summary of flux balance results which are described in more detail in the modeling section but highlighted here. The important point to make is that this is good news because, if true, it means that acceleration of the native pathway in the target organism P. putida would likely result in bacteria capable of outcompeting their normal counterparts, reducing the need to re-apply.
Colocalization of muconolactone D-isomerase (EC:5.3.3.4) and 3-oxoadipate enol-lactone hydrolase (EC:3.1.1.24) are predicted to lead to increased catechol degradation through metabolic channeling
In order to determine which enzymes would most benefit from metabolic channeling in the catechol degradation pathway, we used a cellular simulation tool, developed in our lab, called Cell++. It allows us to place enzymes of choice in a compartment within a cellular environment and calculates the effect of localization on metabolite concentrations in a user-defined biochemical pathway (Sanford et al. 2006). We gathered kinetic data of the five enzymes in the degradation pathway and investigated the effects of localizing pairs of sequential enzymes (i.e. catechol 1, 2-dioxygenase and muconate cycloisomeras) on metabolite concentrations. Four co-localization simulations were performed in Cell++ along with a control simulation where no enzymes were co-localized. The initial metabolite in the simulation environment, catechol, was added into the simulation environment and the simulation environment was run for 10,000 iterations to observe the effect on catechol degradation in each simulation. The results are displayed as a table indicating the concentration of all metabolites at 1000 equidistant time points during the simulation.
To make use of this information, we extracted the maximum metabolite concentration and the maximum rate of metabolite formation for all metabolites during each simulation. These values are normalized from a scale of 0 to 1, where 0 indicates the lowest value of the concentration/rate of formation (C/RoF) in the simulations and 1 is the highest. These values were further evaluated against the control simulation to the find the percentage change of the C/RoF values of each metabolite in the four co-localization simulations. In order to classify a particular enzyme co-localization as beneficial, we need to see an increase in the maximum concentration and rate of formation of the final metabolite in the pathway (meta6). These increases would represent an increased flux through the pathway. Of the four co-localization simulations, simulation 3 (which co-localizes the enzymes muconolactone D-isomerase and 3-oxodipate-enol lactone hydrolase) was the only simulation that matched the criteria for a beneficial co-localization. From these simulations, we decided to co-localize these two enzymes for our wet lab experiments to see if Cell++ accurately depicted the effects on catechol degradation.
Recombinantly expressed microcompartments assemble in vivo
Kris your EM goes here with the appropriate description.
 "
"


