Team:UNIPV-Pavia/Material Methods/Measurements/Tecan/test28settembre
From 2010.igem.org
m (→RESULTS) |
m (→RESULTS) |
||
| Line 75: | Line 75: | ||
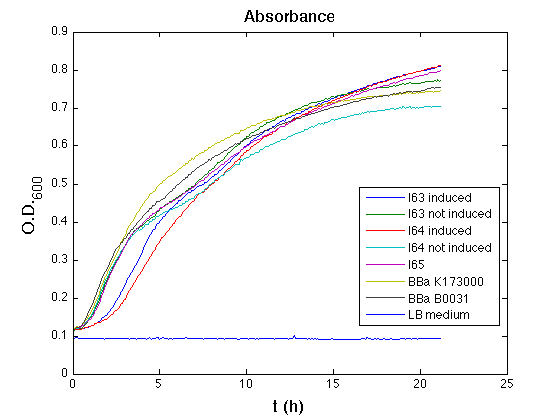
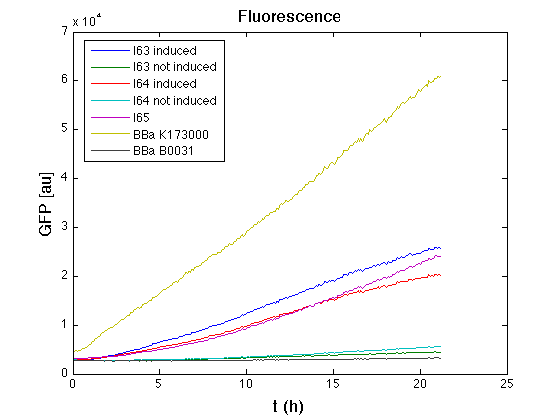
In GFP curve it's possible to appreciate that in induced I63, I64 and I65 GFP accumulation profile it's very similar and it's significantly different from that of negative control <partinfo>BBa_B0031</partinfo>. On the other hand not induced I63 and I64 show a profile very similar to the last one. These results show the right folding of the green fluorescent protein assembled downstream of the genetic circuit and that the inducible system works as expected. | In GFP curve it's possible to appreciate that in induced I63, I64 and I65 GFP accumulation profile it's very similar and it's significantly different from that of negative control <partinfo>BBa_B0031</partinfo>. On the other hand not induced I63 and I64 show a profile very similar to the last one. These results show the right folding of the green fluorescent protein assembled downstream of the genetic circuit and that the inducible system works as expected. | ||
| - | + | The mean protein synthesis rate was also computed over the growth exponential phase, showing again an appreciable GFP production rate for I65 and a lower one for inducible constructs. Also not induced I64 and I65 show a low GFP synthesis rate maybe due to 3OC6HSL inducible circuit leakage activity. | |
<!-- table previous next test --> | <!-- table previous next test --> | ||
Revision as of 13:14, 26 October 2010
|
|
||||||||||||||||||||||||||||||||
|
|
|
||||||||||||||||||||||||||||||
 "
"


