Team:TU Delft/Modeling/HC regulation
From 2010.igem.org
Lbergwerff (Talk | contribs) (→Hydrocarbon regulated expression system) |
Lbergwerff (Talk | contribs) (→Hydrocarbon regulated expression system) |
||
| Line 36: | Line 36: | ||
'''Equations''' | '''Equations''' | ||
| - | It is assumed that the binding of alkanes to AlkS goes so fast that it can be considered in equilibrium. The binding of AlkS to alkanes is described by an equilibrium equation; | + | It is assumed that the binding of alkanes to AlkS goes so fast in comparison to other processes that it can be considered in equilibrium. The binding of AlkS to alkanes is described by an equilibrium equation; |
[[Image:Team_TUDelft_Eq1.png|centre]] | [[Image:Team_TUDelft_Eq1.png|centre]] | ||
| Line 42: | Line 42: | ||
The concentrations and K<sub>HC</sub> are in μM. | The concentrations and K<sub>HC</sub> are in μM. | ||
| - | The production of mRNA from the DNA is described by | + | The production of mRNA from the DNA is described by ODEs; |
[[Image:Team_TUDelft_Eq2.png|centre]] | [[Image:Team_TUDelft_Eq2.png|centre]] | ||
| Line 60: | Line 60: | ||
The concentrations and K values are in μM. | The concentrations and K values are in μM. | ||
| - | pAlkS1 inhibits when it is bound so | + | pAlkS1 inhibits when it is bound so binding has a negative value. The beta-values in the ODE are lumped parameters for promoter strength and transcription speed. |
| - | The change in protein concentration is also described by | + | The change in protein concentration is also described by ODEs; |
[[Image:Team_TUDelft_Eq7.png|centre]] | [[Image:Team_TUDelft_Eq7.png|centre]] | ||
| Line 78: | Line 78: | ||
10<sup>-6</sup> μmol mol<sup>-1</sup> / (1 μm<sup>3</sup> * 10<sup>-15</sup> L μm<sup>-3</sup> * 6.02214179 * 10<sup>23</sup> mol<sup>−1</sup>) = 1.66 * 10<sup>-3</sup> μM molecule<sup>-1</sup> | 10<sup>-6</sup> μmol mol<sup>-1</sup> / (1 μm<sup>3</sup> * 10<sup>-15</sup> L μm<sup>-3</sup> * 6.02214179 * 10<sup>23</sup> mol<sup>−1</sup>) = 1.66 * 10<sup>-3</sup> μM molecule<sup>-1</sup> | ||
| + | |||
mRNA has a lifetime of around 5 minutes in the cell to translate this into a degradation constant for the ODE, it is assumed that 90% of the mRNA molecules degrade in 5 minutes. This gives the following degradation constant for mRNA; | mRNA has a lifetime of around 5 minutes in the cell to translate this into a degradation constant for the ODE, it is assumed that 90% of the mRNA molecules degrade in 5 minutes. This gives the following degradation constant for mRNA; | ||
| - | -1/300 s * log(0.1) = 7.675 * 10<sup>-3</sup> s<sup>-1</sup> | + | k<sup>deg</sup><sub>mRNA</sub> = -1/300 s * log(0.1) = 7.675 * 10<sup>-3</sup> s<sup>-1</sup> |
| + | |||
| - | For the proteins a lifetime of | + | For the proteins the lifetime is in the order of hours instead of minutes, so a lifetime of 1 hour is estimated; |
| - | -1/3600 s * log(0.1) = 6.396 * 10<sup>-4</sup> s<sup>-1</sup> | + | k<sup>deg</sup><sub>AlkS</sub> = k<sup>deg</sup><sub>AlkB</sub> = -1/3600 s * log(0.1) = 6.396 * 10<sup>-4</sup> s<sup>-1</sup> |
Revision as of 08:49, 25 October 2010
Hydrocarbon regulated expression system
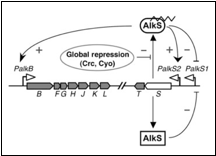
The regulation system for alkane degradation in P. putida is shown in the figure 1;
The sensor molecule of this system is AlkS. AlkS can bind to alkanes and form the complex AlkS-HC (HC is short for hydrocarbon). In reality this happens in the membrane and the complex then migrates into the cell and binds to DNA. In the model however everything is assumed to happen in the cytosol.
The AlkS has a self-regulation through two promoters, pAlkS1 and pAlkS2. pAlkS1 is inhibited by binding to any form of AlkS and pAlkS2 is induced by binding to AlkS-HC. The promoters are independent of each other. The alkane degradation pathway the AlkBFGHJKLT operon (AlkB for short) is regulated by the pAlkB promoter and is also induced by AlkS-HC.
This resulting logic is displayed in table 1.
Table 1, logic from control system. The alkane concentration is the input signal:
| Alkane concentration | AlkS concentration | AlkB concentration |
| None | Low | None |
| High | Medium | High |
AlkS is a sensing molecule and is maintained at low levels in absence of alkanes. This is done by promoter pAlkS1. pAlkS1 is inhibited by any form of AlkS and reaches therefore steady state with a basal level of AlkS. When alkanes are present the target of the cell is to produce AlkB as quickly as possible. To do this AlkS levels are increased because of the binding of alkanes with AlkS, which forms AlkS-HC, which activates pAlkS2. This increases AlkS levels, which inhibits pAlkS1, but pAlkS2 keeps being active because of the presence of both alkanes and AlkS. The presence AlkS-HC simultaneously activates pAlkB. The levels AlkB should be higher than AlkS, as AlkB is an enzyme, while AlkS is a sensing molecule.
This model was intended to aid in the characterization of the two constructs for the sensing project. However, not all these constructs were succesfuly created, so the model is only a proof of concept of capturing the logic in this regulation mechanism. The global regulation by crc was left out for this proof of concept.
Equations
It is assumed that the binding of alkanes to AlkS goes so fast in comparison to other processes that it can be considered in equilibrium. The binding of AlkS to alkanes is described by an equilibrium equation;
The concentrations and KHC are in μM.
The production of mRNA from the DNA is described by ODEs;
The concentrations are in μM, βmax kdeg and μ are in s-1, f is unitless.
The f stands for a function that describes the activity of a promoter with a Hill function;
The concentrations and K values are in μM.
pAlkS1 inhibits when it is bound so binding has a negative value. The beta-values in the ODE are lumped parameters for promoter strength and transcription speed.
The change in protein concentration is also described by ODEs;
The concentrations are in μM, βmax kdeg and μ are in s-1.
Here the beta-values are a lumped value for rbs strength and transcription speed.
Assumptions
A cell has a volume of 1 μm3, to convert amount of molecules per cell to a concentration the following number was used;
10-6 μmol mol-1 / (1 μm3 * 10-15 L μm-3 * 6.02214179 * 1023 mol−1) = 1.66 * 10-3 μM molecule-1
mRNA has a lifetime of around 5 minutes in the cell to translate this into a degradation constant for the ODE, it is assumed that 90% of the mRNA molecules degrade in 5 minutes. This gives the following degradation constant for mRNA;
kdegmRNA = -1/300 s * log(0.1) = 7.675 * 10-3 s-1
For the proteins the lifetime is in the order of hours instead of minutes, so a lifetime of 1 hour is estimated;
kdegAlkS = kdegAlkB = -1/3600 s * log(0.1) = 6.396 * 10-4 s-1
When there are no alkanes present only pAlkS1 is active and all other promoters are completely inactive. It is assumed that in this state there are 25 molecules of AlkS and 5 molecules of mRNA for AlkS are present. It is also assumed that the copy number is 1 and a growth rate of 0.1 h-1 is assumed.
pAlkS1 is assumed to be 50% active in this situation, solving the Hill equation gives a K value of;
KS1 = 25 molecules * 1.66 * 10-3 μM molecule-1 = 0.166 μM
This reduces the ODEs for AlkS to;
Solving this for steady state gives;
βmaxS1 = 7.703 * 10-2
βmaxAlkS = 3.337 * 10-3
For full expression of AlkS with high alkane concentration it is assumed that the concentration of AlkS increases 5-fold to 500 molecules. AlkB is assumed to have a concentration of around 1000 molecules. These concentrations are assumed to be reached when the alkane concentration reaches 1 μM. Most of the alkane should be free to be degraded so it is assumed that only 1% of the alkanes is bound to AlkS in this situation. This gives a K value of;
KHC = 41.10
For pAlkS2 and pAlkB 99% activity is assumed;
KS2 = 1.005 * 10-3
KB = 1.005 * 10-3
At this AlkS level pAlkS1 should become virtually inactive and the ODEs reduce to;
Solving this for steady state gives;
βmaxS2 = 0.1556
βmaxB = 0.3890
βmaxAlkB = 3.337 * 10-3
Results
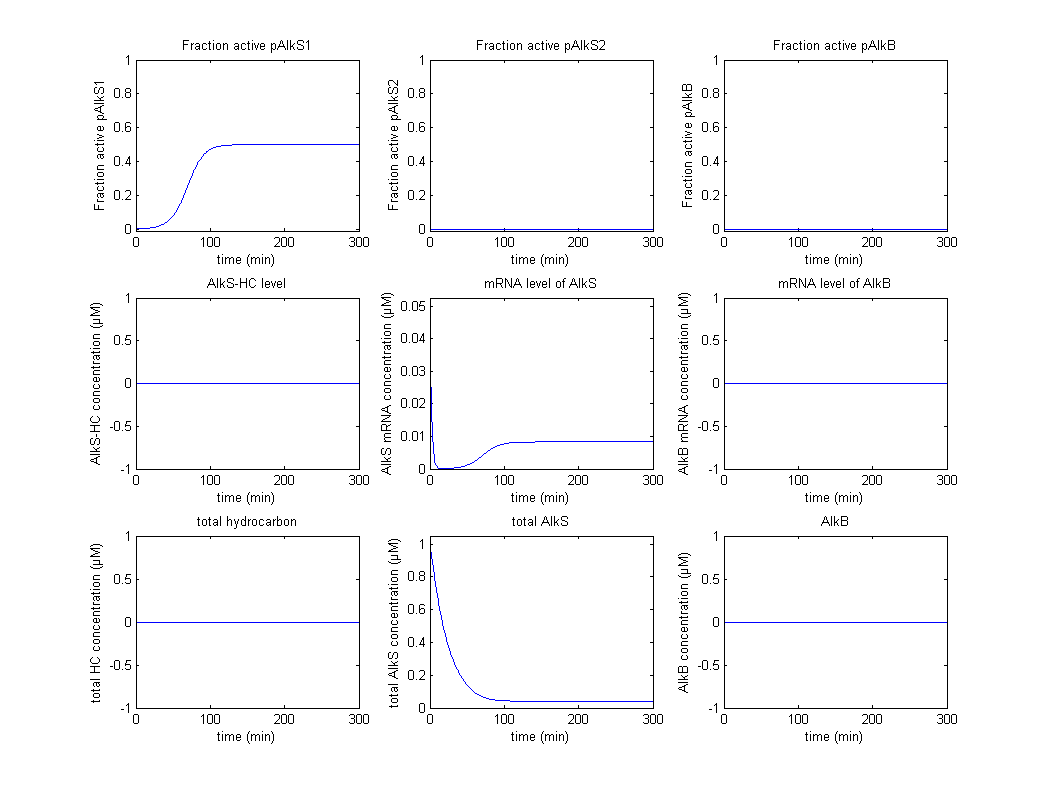
The original idea was to characterize the biobricks containing pAlkS1, pAlkS2 and pAlkB and fit the model to the data of the characterization. Not all promoters were succesfully transformend into BioBricks however, and the results have reduced to a proof of prinicple that shows that the system follows the correct logic from table 1. Firstly the self regulation of AlkS is displayed in figure 2 and figure 3.
In figure 2 it can be seen that pAlkS1 is fully active when there is no AlkS and no alkanes, this causes transcription of the AlkS gene and produces the protein AlkS. This in turn reduces the activity of pAlkS1 until a steady state is achieved. In figure 3 there is also no alkanes present, however a large amount of AlkS and mRNA for AlkS were given as initial values. It can be seen that no promoter is active for these high concentrations and the concentrations of AlkS and mRNA start to drop. The lowering concentrations of AlkS start to activate the promoter AlkS until the same steady-state as before is reached.
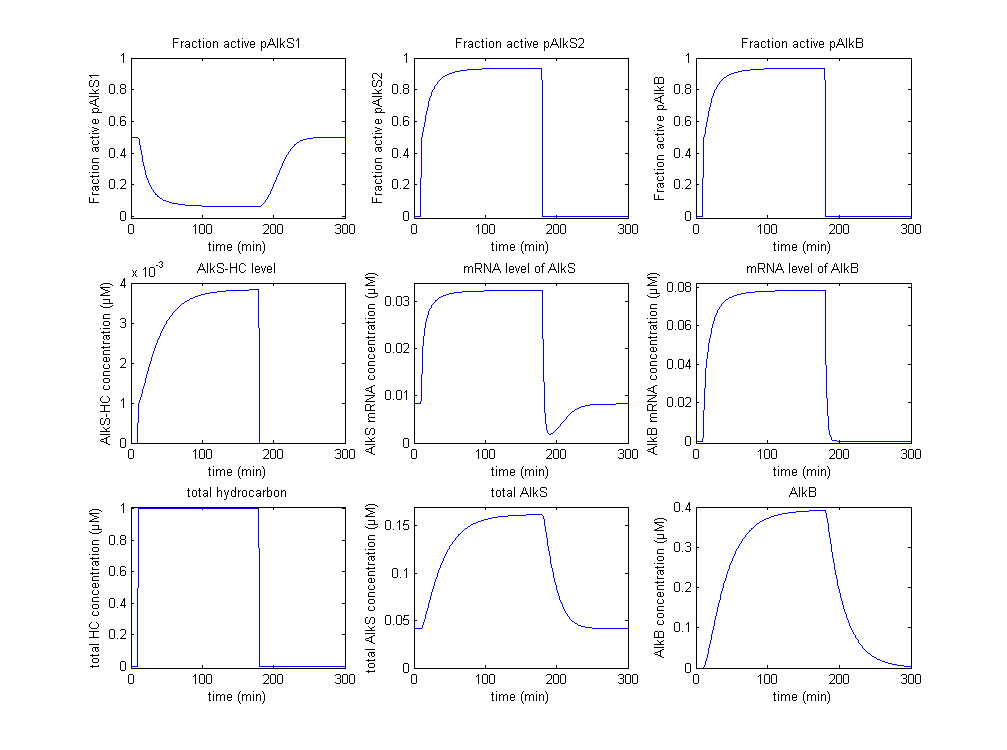
In figure 4 a scenario is displayed in which the system starts at steady state and after some time an input signal, a high alkane concentration, is introduced. After some time the signal is removed, this is not realistic, but it is interesting to see how the system responds.
As soon as the alkanes are introduced (bottom right graph), it is bound by AlkS (centre right graph). This binding goes very fast as it was assumed that this process is in steady state. This causes a initial fast activation of pAlkS2 and pAlkB, which results in increasing concentrations of AlkS and AlkB. The increasing concentration causes a secondary slow response in which more AlkS and AlkB are generated, shutting down pAlkS1. The AlkS however binds more alkanes as there is more AlkS. This causes both AlkS and AlkB to increase until a steady state is reached.
When the input signal, the alkane concentration, is removed (again it is not very realistic, it is just to see the system respond), the system readjusts itself to the steady-state as it was before the activation. There are no alkanes anymore, so all AlkS is unbound. Because of this pAlkS2 and pAlkB become completely inactive. The mRNA molecules, AlkS and AlkB are now degraded until the old steady state is formed.
Go back to the main modeling menu here
 "
"


