FACS analysis of fluorescent proteins
From 2010.igem.org
| (One intermediate revision not shown) | |||
| Line 41: | Line 41: | ||
<p style="font-size:12pt">'''Data Received From Flow Cytometry and Analysis '''</p> | <p style="font-size:12pt">'''Data Received From Flow Cytometry and Analysis '''</p> | ||
| - | The graph shown below is an example of a single-parameter histogram obtained from the | + | The graph shown below is an example of a single-parameter histogram obtained from the flow cytometry during our experiment. These graphs display a single measurement parameter; the relative fluorescence (as shown above) or light scatter intensity on the x-axis and the number of events (cell count) on the y-axis. This graph is very useful for evaluating the total number of cells in a sample that have the physical properties selected for or which express the marker of interest (as is the case with our project). The graph involves flow analysis on a mixed population of cells (some expressing GFP and some are not) this results in several peaks on the histogram. In order to identify the positive dataset, a positive and a negative control is used for positive identification of the peak corresponding to the cells which were and which were not expressing GFP. |
| Line 55: | Line 55: | ||
In preparation of the Flow cytometry analysis we; | In preparation of the Flow cytometry analysis we; | ||
| - | 1. Washed and resuspended samples in PBS at a density of 10<sup style="font-size:10px">5</sup>-10 | + | 1. Washed and resuspended samples in PBS at a density of 10<sup style="font-size:10px">5</sup>-10<sup style="font-size:10px">7</sup> cells/ml.<br> |
2. Less than 1 ml was required for analysis and cells were stored on ice until analysed then vortexed before analysed. | 2. Less than 1 ml was required for analysis and cells were stored on ice until analysed then vortexed before analysed. | ||
Latest revision as of 20:06, 27 October 2010
University of Aberdeen - ayeSwitch
Flow cytometry Analysis of fluorescence Proteins
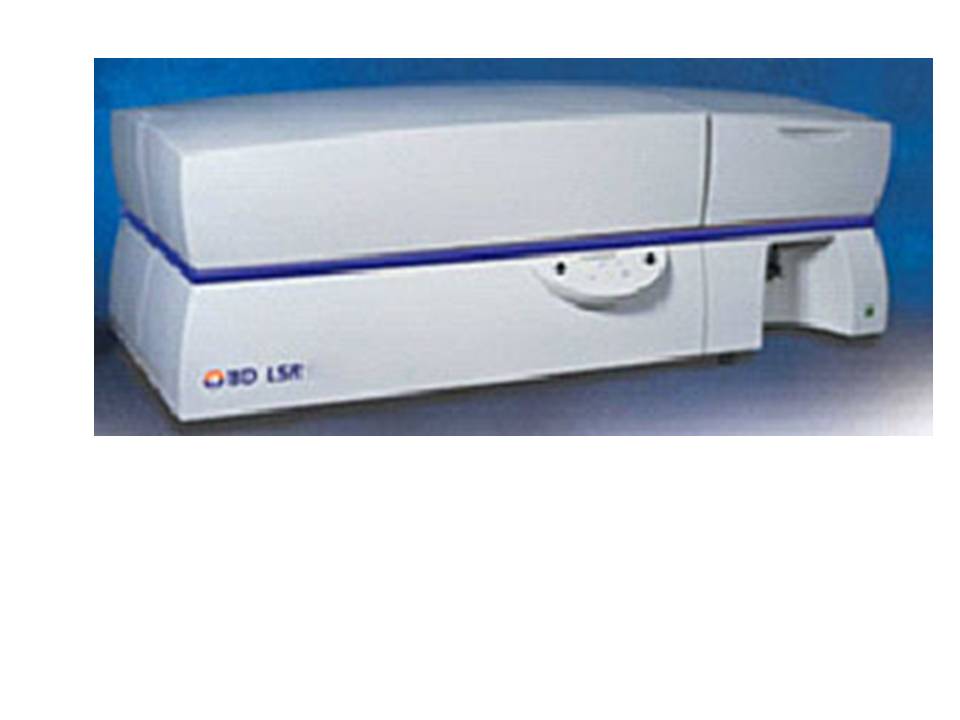
The flow cytometer used by our team was the Becton Dickinson 'LSRII '
Please note that as a technique, flow cytometry was used in many of our experiments although this is frequently referred to in our wiki text as FACS (Fluorescent activated cell sorting) analysis . However, we stress that in fact no cell sorting was performed in our experiments.
Flow cytometry and Its Advantages
Flow cytometry (FCM) is a technique used for counting and examining individual microscopic particles such as cells on the basis of their fluorescence. One of its unique features is that it measures fluorescence per cell or particle, contrasting with spectrophotometry which measures absorption and transmission of wavelengths as a bulk volume of the sample.
How Flow Cytometry Works
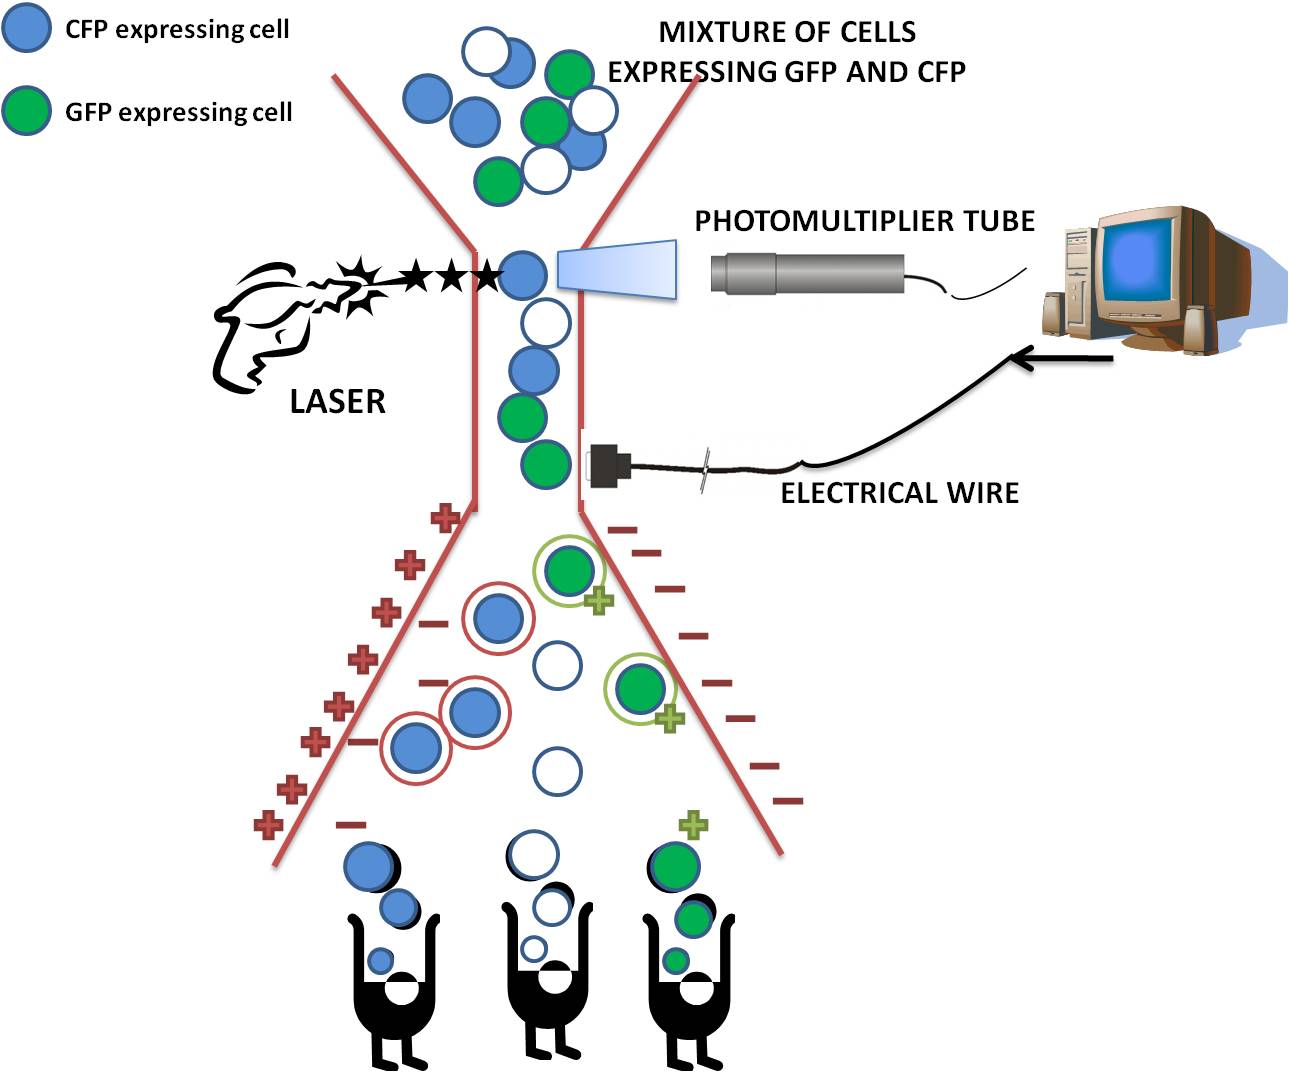
The sample is injected into the center of the sheath stream of flow cytometer in a liquid state; therefore the particles are distributed randomly. The fluidics system is then responsible for separating out the particles into an ordered stream of single particles.
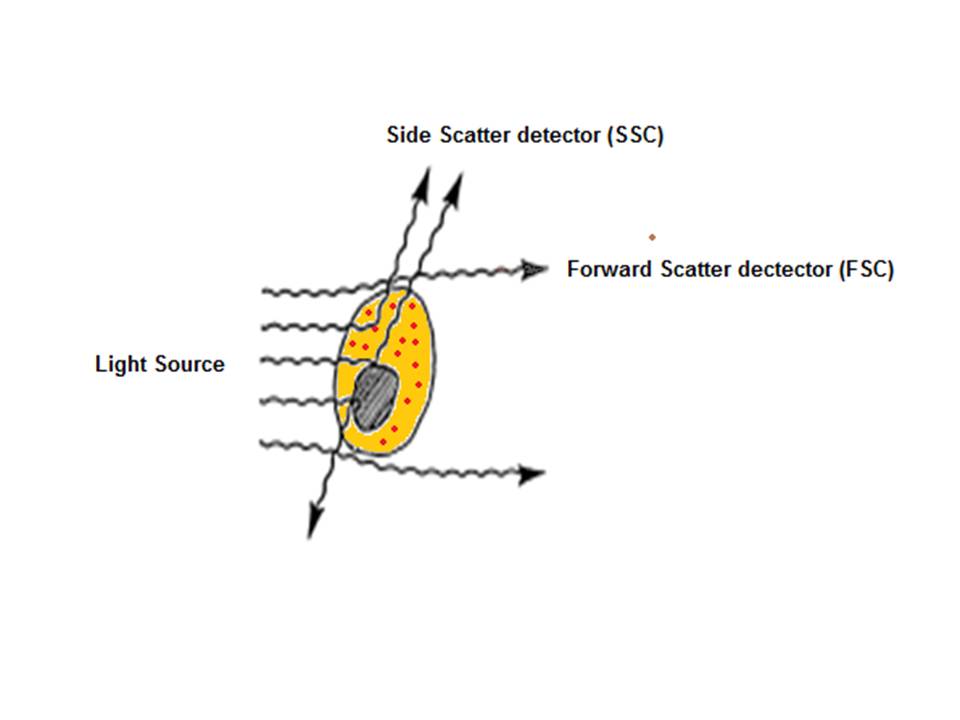
After hydrodynamic focusing, the cells or particles of interest pass through the laser beam therefore intercepting and scattering the light which excites the fluorochromes to a higher energy state. The energy is then released as a photon of light with spectral properties unique to specific fluorochromes. Light scattered in the forward direction (as shown in the below diagram) is collected by a lens which is in line with the beam known as the forward scatter channel (FSC). The FSC intensity gives the particles size and can give information used to distinguish between cellular debris and living cells. The side scatter channel (SSC) is perpendicular to the beam and provides information about the granular content within a particle. Both FSC and SSC are unique for each particle and a combination of the two may be used to differentiate between different cell types in a heterogeneous sample.
Cell Sorting
Fluorescence-activated cell sorting (FACS) is a specialized type of flow cytometry. The rate of flow sorting at 10 000 cells/second provides a method for sorting a heterogeneous mixture of biological cells into separate storage containers. It is based upon the specific light scattering and fluorescent characteristics of each cell. It is an extremely useful scientific instrument, as it provides fast, objective and quantitative recording of fluorescent signals from individual cells as well as physical separation of cells of particular interest.
How Cell Sorting Works
After the cells have passed through the laser beam and the detectors, a vibrating mechanism causes the stream of cells to break into individual droplets. An electrical charge is placed at the point where the stream breaks into droplets immediately prior to the fluorescence intensity measurement, and the opposite charge is trapped on the droplet as it breaks from the stream. The droplets then travel through a strong electrostatic field and are deflected based on their charge into waiting sample tubes. The number of cells and level of fluorescence in each tube is then known.
Variables Considered for Our Project When Using the Flow Cytometry.
During our experiment our choice of fluorochrome was restricted by the possibility of spectral overlap. When two or more fluorochromes are used during a single experiment there is a chance that their emission profiles will coincide, making measurement of the true fluorescence emitted by each particle very difficult. Therefore careful consideration of the excitation and emission wavelengths of the Green Fluorescent Protein and the Cyan Fluorescent Protein was carried out prior to the experiment to ensure there was no overlap.
Data Received From Flow Cytometry and Analysis
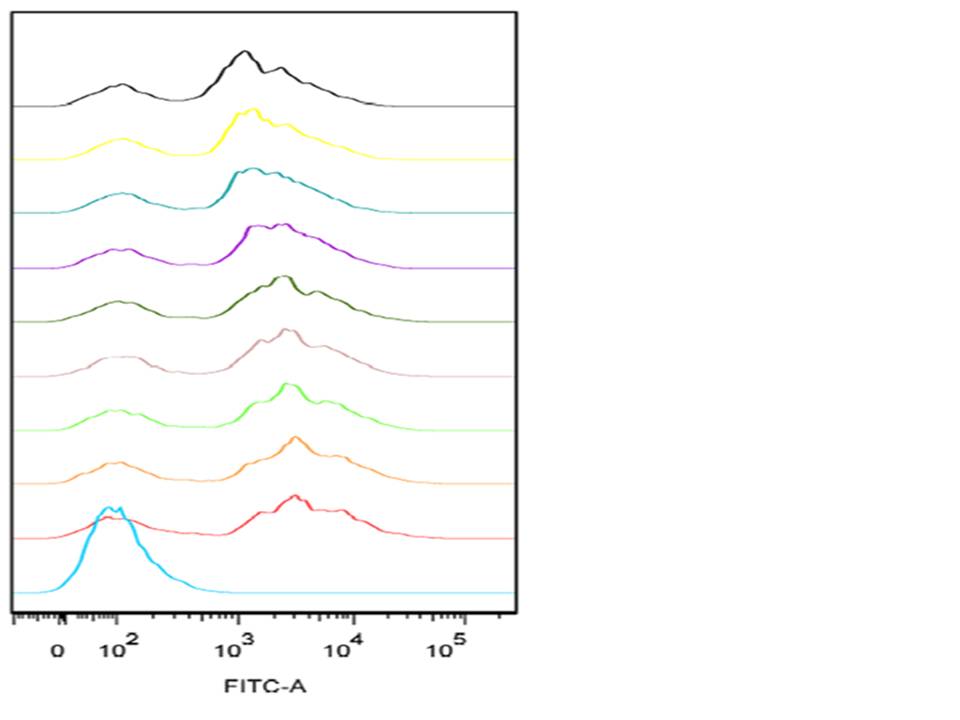
The graph shown below is an example of a single-parameter histogram obtained from the flow cytometry during our experiment. These graphs display a single measurement parameter; the relative fluorescence (as shown above) or light scatter intensity on the x-axis and the number of events (cell count) on the y-axis. This graph is very useful for evaluating the total number of cells in a sample that have the physical properties selected for or which express the marker of interest (as is the case with our project). The graph involves flow analysis on a mixed population of cells (some expressing GFP and some are not) this results in several peaks on the histogram. In order to identify the positive dataset, a positive and a negative control is used for positive identification of the peak corresponding to the cells which were and which were not expressing GFP.
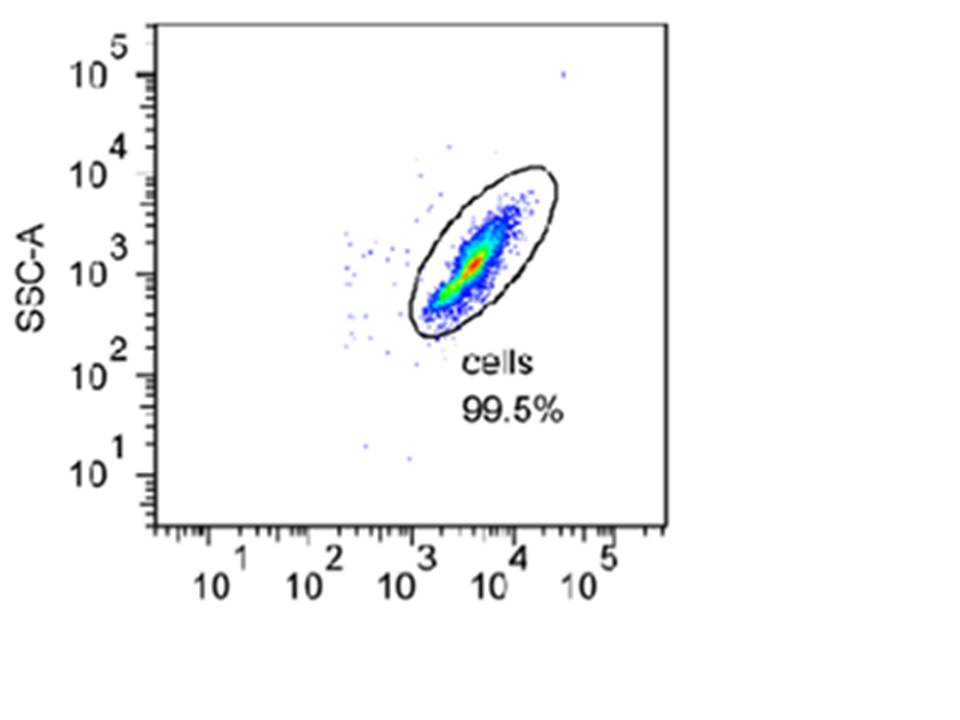
Below is an example of a density plot taken during one of our experiments. In this plot, the particle counts are shown by dot density. Each cell recorded i.e. one of the dots shown above, is referred to as an event. The green colour represents larger number of events and the red one even more. The different colours are used to create a three-dimensional feel.
In preparation of the Flow cytometry analysis we;
1. Washed and resuspended samples in PBS at a density of 105-107 cells/ml.
2. Less than 1 ml was required for analysis and cells were stored on ice until analysed then vortexed before analysed.
 Return to Protocols Return to Protocols
|
 "
"
