Team:TU Delft/Project/tolerance/results
From 2010.igem.org
(→Solvent tolerance) |
(→Survival Results & Conclusions) |
||
| (2 intermediate revisions not shown) | |||
| Line 2: | Line 2: | ||
__NOTOC__ | __NOTOC__ | ||
| - | ==Survival | + | ==Survival Results & Conclusions== |
===Solvent tolerance=== | ===Solvent tolerance=== | ||
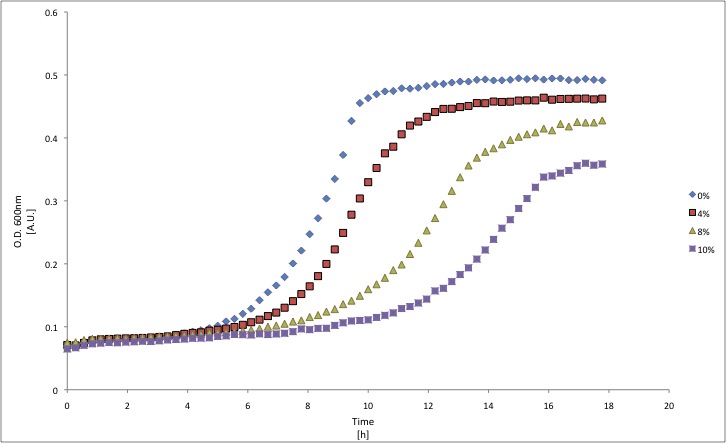
| - | The solvent tolerance cluster ([http://partsregistry.org/wiki/index.php?title=Part:BBa_K398406 BBa_K398406]) was expressed | + | The solvent tolerance cluster ([http://partsregistry.org/wiki/index.php?title=Part:BBa_K398406 BBa_K398406]) was expressed in ''E. coli'' K12. The growth rate of cells was challenged by different amounts of n-hexane. The results (Fig. 1) suggest that this part indeed improves growth under high n-hexane conditions. The parental strain ''E. coli'' K12 was growing very slowly at 10% (v/v) of n-hexane/M9 mixture. |
| - | [[Image:TU_Delft_406_K12.jpg|500px|thumb|center|Growth of ''E. coli'' K12 in M9 medium at different n-hexane concentrations. ]] | + | [[Image:TU_Delft_406_K12.jpg|500px|thumb|center|'''Fig. 1:''' Growth of ''E. coli'' K12 in M9 medium at different n-hexane concentrations. ]] |
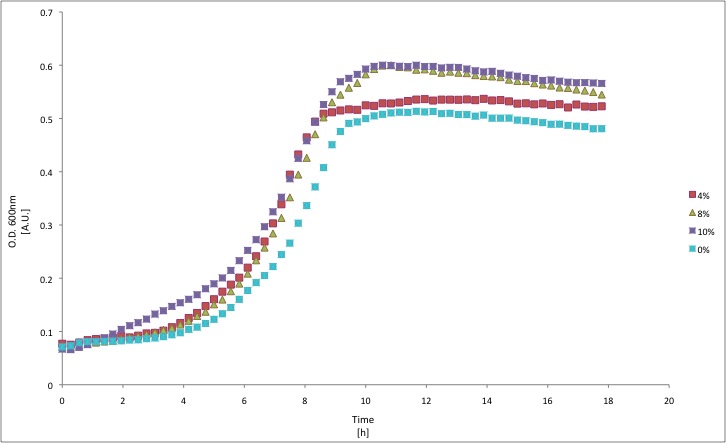
| + | Please note the growth of ''E. coli'' 406 - shows no difficulties under these harsh conditions. | ||
| - | + | [[Image:TU_Delft_406_406.jpg|500px|thumb|center|'''Fig. 2:''' Growth of ''E. coli'' 406A (expressing [http://partsregistry.org/Part:BBa_K398406 BBa_K398406] in pSB1A2) in M9 medium at different n-hexane concentrations. ]] | |
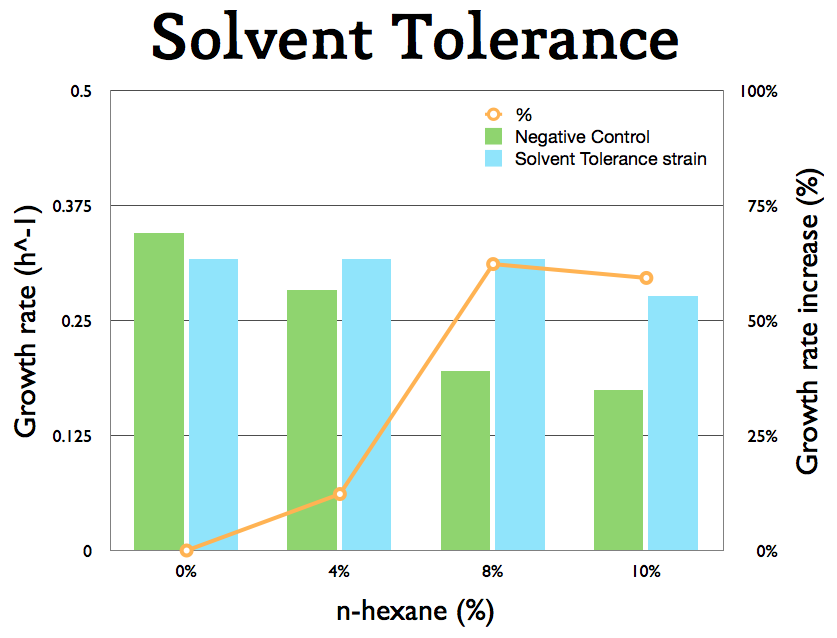
| - | + | The growth rates were determined from the exponential phase (using a trendline, Fig. 3). | |
| + | [[Image:TU_Delft_Solvent_tolerance.jpg|500px|thumb|center|'''Fig. 3:''' Comparison of the growth rates between ''E. coli'' K12 and ''E. coli'' 406A at different n-hexane concentrations in M9 medium. ]] | ||
| - | + | ===Salt tolerance=== | |
| - | + | ||
| - | [ | + | We tested the growth of our bbc1 construct ([http://partsregistry.org/wiki/index.php?title=Part:BBa_K398108 BBa_K398108]) under different [https://2010.igem.org/Team:TU_Delft#page=Project/tolerance/characterization salt concentrations]. |
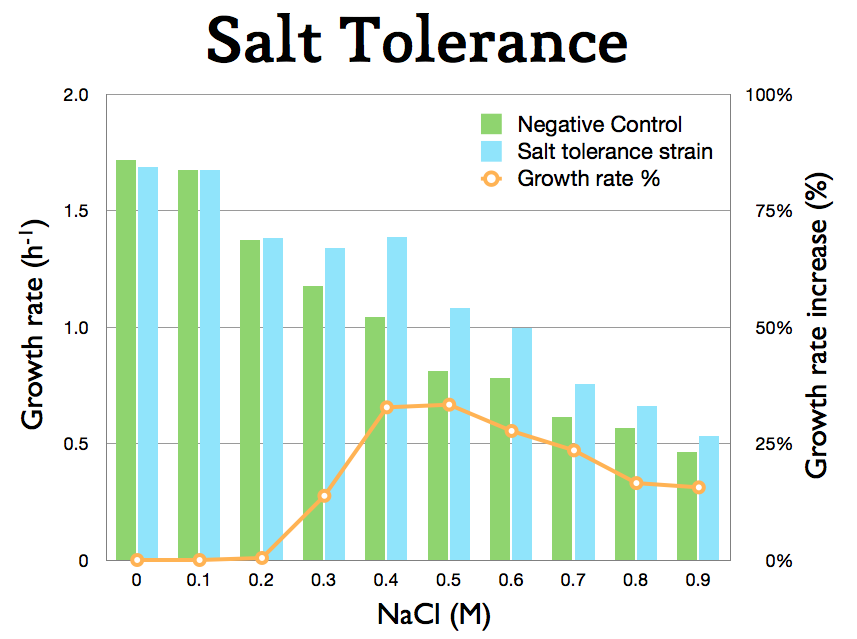
| - | + | The growth rates were determined for the exponential phase (using a trendline, Fig. 4). | |
| - | + | [[Image:TU_Delft_Salt_tolerance.jpg|500px|thumb|center|'''Fig. 4:''' Growth rate in dependence of salt (NaCl).]] | |
| - | + | Up to 0.2 M NaCl effects of salt stress are equally observed for both the negative control and for cells with our biobrick ([http://partsregistry.org/wiki/index.php?title=Part:BBa_K398108 BBa_K398108]). At higher concentrations a significant improvement of growth rate in comparison to the control background ([http://partsregistry.org/wiki/index.php?title=Part:BBa_K398027 BBa_K398027]) is seen. | |
| - | + | ||
| - | + | ===Conclusions=== | |
| + | While at low salt concentrations no phenotype is observed, the resistance to high salt concentrations is significantly improved (up to 35%). The observed behavior can be explained by the vast amount of effects resulting from salt stress. It is possible that our BioBrick assists to reduce one of the inhibiting effects ,and thus leading to a benefit at higher salt stress. | ||
| - | + | It was shown, that our BioBrick indeed increases the salt tolerance for concentrations higher than 0.3 M sodium chloride. The general increase in tolerance varies between 10 and 35% depending on the sodium chloride concentration (showing a peak at 0.5 M NaCl which coincides with the concentration of NaCl in sea water). | |
===Future prospects=== | ===Future prospects=== | ||
Latest revision as of 21:58, 27 October 2010

Survival Results & Conclusions
Solvent tolerance
The solvent tolerance cluster ([http://partsregistry.org/wiki/index.php?title=Part:BBa_K398406 BBa_K398406]) was expressed in E. coli K12. The growth rate of cells was challenged by different amounts of n-hexane. The results (Fig. 1) suggest that this part indeed improves growth under high n-hexane conditions. The parental strain E. coli K12 was growing very slowly at 10% (v/v) of n-hexane/M9 mixture.
Please note the growth of E. coli 406 - shows no difficulties under these harsh conditions.
The growth rates were determined from the exponential phase (using a trendline, Fig. 3).
Salt tolerance
We tested the growth of our bbc1 construct ([http://partsregistry.org/wiki/index.php?title=Part:BBa_K398108 BBa_K398108]) under different salt concentrations.
The growth rates were determined for the exponential phase (using a trendline, Fig. 4).
Up to 0.2 M NaCl effects of salt stress are equally observed for both the negative control and for cells with our biobrick ([http://partsregistry.org/wiki/index.php?title=Part:BBa_K398108 BBa_K398108]). At higher concentrations a significant improvement of growth rate in comparison to the control background ([http://partsregistry.org/wiki/index.php?title=Part:BBa_K398027 BBa_K398027]) is seen.
Conclusions
While at low salt concentrations no phenotype is observed, the resistance to high salt concentrations is significantly improved (up to 35%). The observed behavior can be explained by the vast amount of effects resulting from salt stress. It is possible that our BioBrick assists to reduce one of the inhibiting effects ,and thus leading to a benefit at higher salt stress.
It was shown, that our BioBrick indeed increases the salt tolerance for concentrations higher than 0.3 M sodium chloride. The general increase in tolerance varies between 10 and 35% depending on the sodium chloride concentration (showing a peak at 0.5 M NaCl which coincides with the concentration of NaCl in sea water).
Future prospects
We hope that the salt tolerance can be increased further by adding systems (such as ion pumps) to ensure the intracellular threshold and minimize the effects of salt stress even further. As the host organism would then be able to maintain growth at lethal concentrations of both salt and alkanes. This would allow future generations of igemmers to create cultures in a variety of different media, opening a new field of possibilities.

 "
"


