Team:Kyoto/Project/Goal B
From 2010.igem.org
(→Result) |
(→Experiment 2: Measurement of lytic activity with time) |
||
| (70 intermediate revisions not shown) | |||
| Line 1: | Line 1: | ||
{{:Team:Kyoto/Header}} | {{:Team:Kyoto/Header}} | ||
| - | ==Goal B: | + | ==Goal B: Quantitative characterization of λ lysis cassette== |
===Introduction=== | ===Introduction=== | ||
| - | + | λ lysis cassette is a gene that causes cell lysis. In previous iGEM, some teams evaluated the lytic activity of λ lysis cassette qualitatively. However, the registered parts lack of many informations such as activity or sequence. Thus, the well-characterized lysis cassette provide the simple and reliable cell-death system and will be applied to various circuits. For this reason, we studied about when cells die, how many cells die, and the relationship between them and the activity of its promoter. | |
[[Image:KyotoFigC004.png|300px|center]] | [[Image:KyotoFigC004.png|300px|center]] | ||
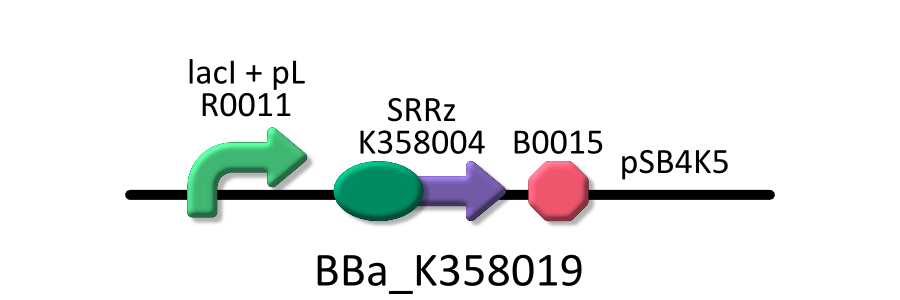
| - | To characterize | + | To characterize lytic activity of λ lysis cassette quantitatively, we regulate the gene expression of λ lysis cassette by a lactose promoter, R0011, which we characterized quantitatively by RPU in GoalA. To repress the basal expression of λ lysis cassette in the absence from IPTG as possible, we used pSB4K5, a low copy vector, as a plasmid backbone and used KRX as a host cell. Needless to say, we characterized R0011 in the same experimental condition. For more detailed explanation of R0011, go [[Team:Kyoto/Project/Goal A|Goal A]]. |
===Result=== | ===Result=== | ||
| - | ====Experiment 1: | + | ====Experiment 1: Quantitative measurement of lytic activity of λ lysis cassette==== |
| - | + | [[Image:KyotoFigA007.png|300px|right]] | |
| - | To characterize the lytic activity of | + | To characterize the lytic activity of λ lysis cassette quantitatively, we had to establish a standard method for a quantitative measurement of cell lysis. We first considered that we could characterize the activities by mesuring OD550 of the cultures after induction of IPTG. However, after preliminary experiments for determination of the measurement condition, we found some facts described below. |
| - | *Cultures induced the expression of | + | *Cultures induced the expression of λ lysis cassette becomes a kind of equilibrium state of cell lysis. |
| - | *R0011 is | + | *R0011 is frequently mutated at 37 degrees if it regulates an expression of toxic gene because of natural selection. |
| - | *The possibility of mutation become low at 30 degrees, although it still remains a little. | + | *The possibility of mutation become low at 30 degrees, although it still remains a little. |
| - | + | Therefore, we made the following protocol that is suitable to our motivation. | |
| - | Therefore, we made the following protocol that is suitable to our motivation. | + | *Pick out three colonies transformed with K358019 and cultivated in supplemented M9 media with certain concentration of IPTG. After incubation of 16h, 18h, 20h, measure OD550 of each culture. |
| - | *Pick out three colonies transformed with | + | We did the experiment as this [[Team:Kyoto/Protocols#Quantitative measurement of lytic activity of λ lysis cassette | protocol]], we got the following data. |
| - | + | ||
| - | We did the experiment as this protocol, we got the following data. | + | |
| - | + | ||
{| | {| | ||
!Incubating | !Incubating | ||
|16h||18h||20h||16h||18h||20h||16h||18h||20h | |16h||18h||20h||16h||18h||20h||16h||18h||20h | ||
|- | |- | ||
| - | ! | + | !Number of colony |
|1||1||1||2||2||2||3||3||3 | |1||1||1||2||2||2||3||3||3 | ||
|- | |- | ||
| Line 63: | Line 60: | ||
|} | |} | ||
| - | Table 1 | + | Table 1 OD550 of each culture incubated 16h, 18h, 20h, with various concentration of IPTG. The number of colony indicates which colony the cultures are drived from. The values of OD550 of 16h, 18h, 20h are derived from the same culture with certain concentration of IPTG. |
| - | As Table1 shows, | + | As Table1 shows, cell lysis seems to be an apparent equilibrium state. Exceptionally, OD550 increases from 16h to 20h when the concentration of IPTG is 0.8mM and 1.0mM. This exceptions seem to be mutated in the region of R0011, so we don't think about this). The value of OD550 in this state depends on the strength of induction of IPTG, thus we define it as LAV(Lytic Activity Value), which indicates the lytic activity of λ lysis cassette quantitatively. |
| - | [[Image:KyotofigD001.png|600px|thumb|center|Fig.1 | + | [[Image:KyotofigD001.png|600px|thumb|center|Fig.1 LAV of 18h cultures with various concentration of IPTG. When the concentration of IPTG is from 0.01mM to 0.02mM, LAV decreases mildy. When the concentration of IPTG is from 0.02mM to 0.05mM, LAV decreases dramatically. When the concentration of IPTG is over 0.05mM, OD550 is under 0.3 and doesn't change largely. Green points are the result of 1.0mM and 0.8mM of IPTG. Pink point is a control, the concentration of IPTG is 0mM.]] |
To analyze the relationship between the lytic activity of λ lysis cassette and RPU, we used the result of characterization of R0011. | To analyze the relationship between the lytic activity of λ lysis cassette and RPU, we used the result of characterization of R0011. | ||
| - | [[Image:KyotofigD002.png|600px|thumb|center|Fig.2 | + | [[Image:KyotofigD002.png|600px|thumb|center|Fig.2 LAV vs. RPU. The horizontal axis of Fig. 1 is converted to RPU using the result of [[Team:Kyoto/Project/Goal A|characterization of R0011.]]]] |
| - | + | RPU is relative activity of promoter, so Fig. 2 shows the relationship between the lytic activity of λ lysis cassette and its expression level. The lysis cassette effectively induced cell lysis even when the expression was very repressed (0.2 RPU). Moreover, the activity of the cell lysis has a distinct threshold around 0.1 RPU. In case of the higher induction than 0.2 RPU, the cell populations reached a plateau but not zero. | |
| - | ====Experiment 2: Measurement of lytic activity | + | ====Experiment 2: Measurement of lytic activity with time==== |
| + | To characterize the lytic activity of λ lysis cassette in more detail, we focused on when cell lysis occurs after induction of IPTG. We did the experiment as this [[Team:Kyoto/Protocols#Measurement of lytic activity with time | protocol]], we got the following data | ||
| - | [[Image: | + | [[Image:KyotoGrp101028-1.png|600px|center]] |
| + | [[Image:KyotoPhoto2a.jpg|300px|left]][[Image:KyotoPhoto4a.jpg|300px|left]][[Image:KyotoPhoto7a.jpg|300px]] | ||
| + | {{clear}} | ||
| + | Please see our [[Team:Kyoto/Notebook|notebook]]. There is much data about the relationship between cell lysis and the concentration of IPTG. | ||
| + | {{clear}} | ||
| + | [[Image:KyotoGrp101026-1.png|300px]] | ||
[[#top-section|^Top]] | [[#top-section|^Top]] | ||
===Discussion=== | ===Discussion=== | ||
| - | ==== | + | ====Apparent equilibrium state of cell lysis==== |
| - | + | We performed experiments for models of cell lysis using E.coli transformed with the construction, Plac and lysis cassette on the low copy plasmid. We measured A550 at 16h, 18h and 20h with various IPTG concentrations. Several stochastic models are considered from the unexpected results. Please refer to [[ Team:Kyoto/Modeling#Model2: Cell Lysis | Modeling ]] for further details. | |
| - | the | + | |
| - | + | ====Condition of promoters for λ lysis cassette==== | |
| - | + | We characterized λ lysis cassette quantitatively with RPU. From our data, we determined a condition of activity of promoters. If you want to make inducible systems of cell lysis which use λ lysis cassete, the condition is as follows: the minimum activity is under 0.1 RPU and the maximum activity is over 0.2 RPU. Promoters that meet this condition can be applied to λ lysis cassette. | |
| - | + | ||
| - | + | ||
| - | ==== | + | ====Initiation of cell lysis==== |
| - | + | We measured the time of Initiation of cell lysis for different concentration of IPTG. From our data, the higher concentration of IPTG is the earlier cell lyses. We can regulate the timing of initiation of cell lysis by controlling concentration of IPTG. | |
| - | |||
| - | |||
| - | |||
| - | |||
[[#top-section|^Top]] | [[#top-section|^Top]] | ||
| - | |||
| - | |||
| - | |||
| - | |||
| - | |||
| - | |||
| - | |||
| - | |||
Latest revision as of 03:59, 28 October 2010
Contents |
Goal B: Quantitative characterization of λ lysis cassette
Introduction
λ lysis cassette is a gene that causes cell lysis. In previous iGEM, some teams evaluated the lytic activity of λ lysis cassette qualitatively. However, the registered parts lack of many informations such as activity or sequence. Thus, the well-characterized lysis cassette provide the simple and reliable cell-death system and will be applied to various circuits. For this reason, we studied about when cells die, how many cells die, and the relationship between them and the activity of its promoter.
To characterize lytic activity of λ lysis cassette quantitatively, we regulate the gene expression of λ lysis cassette by a lactose promoter, R0011, which we characterized quantitatively by RPU in GoalA. To repress the basal expression of λ lysis cassette in the absence from IPTG as possible, we used pSB4K5, a low copy vector, as a plasmid backbone and used KRX as a host cell. Needless to say, we characterized R0011 in the same experimental condition. For more detailed explanation of R0011, go Goal A.
Result
Experiment 1: Quantitative measurement of lytic activity of λ lysis cassette
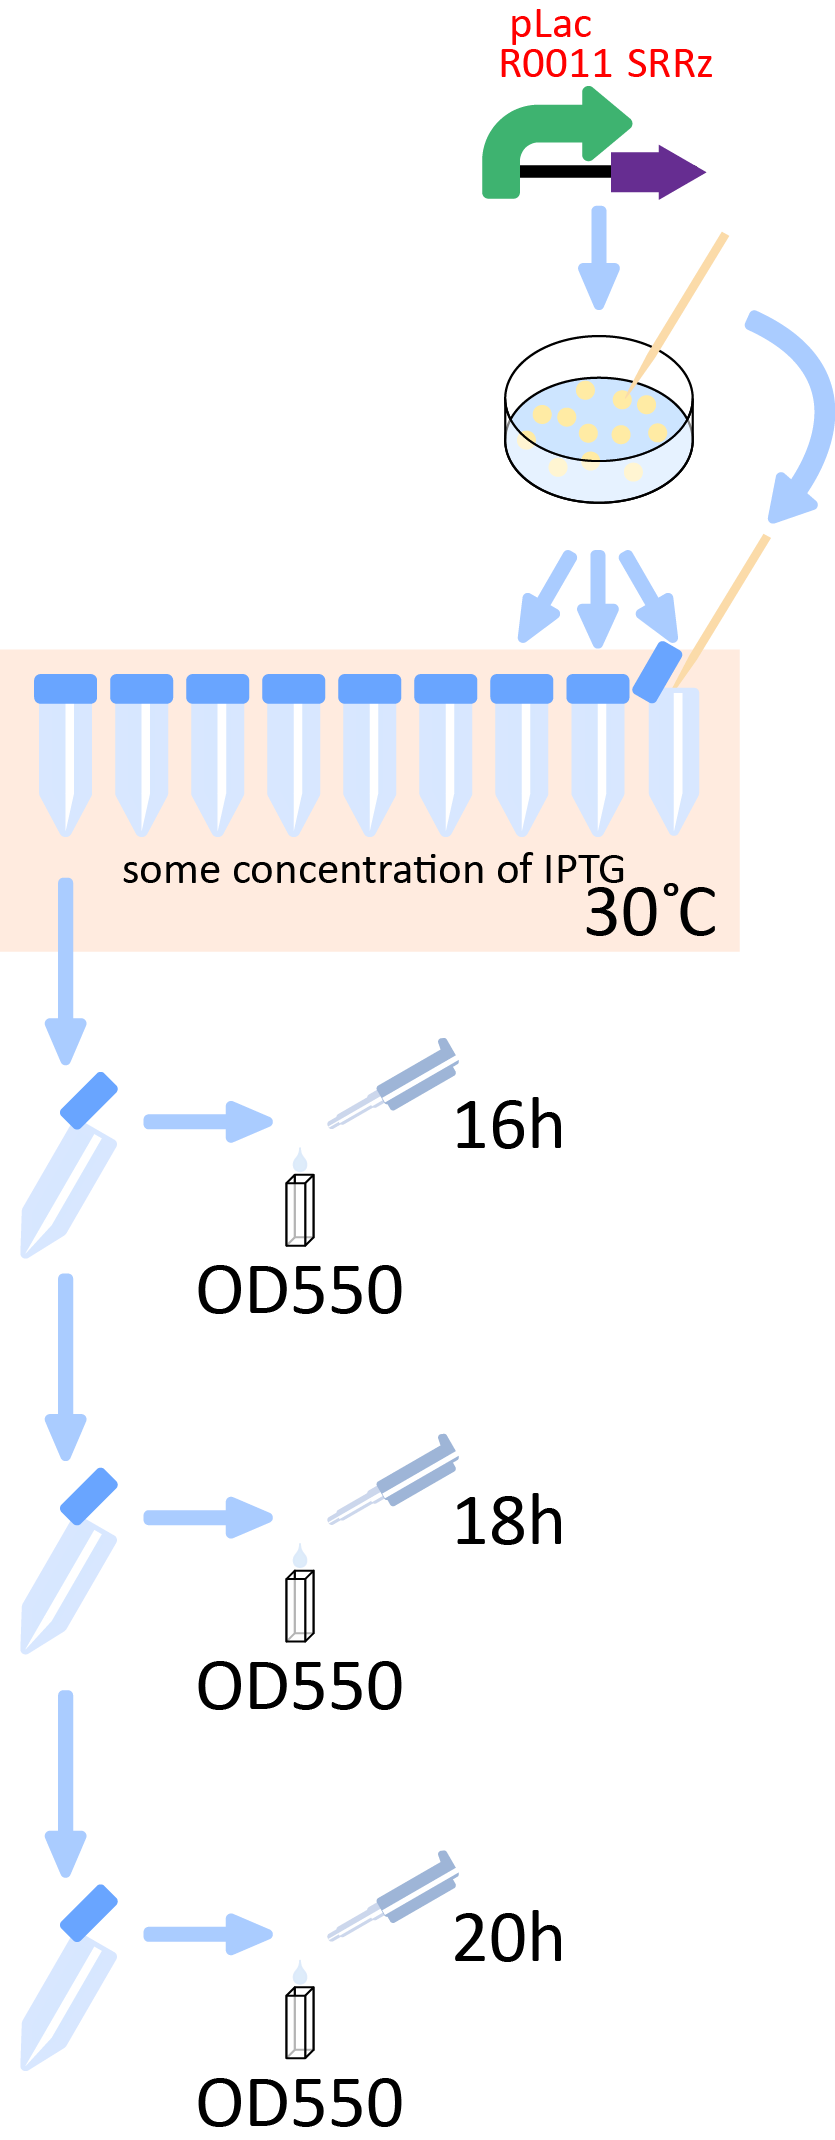
To characterize the lytic activity of λ lysis cassette quantitatively, we had to establish a standard method for a quantitative measurement of cell lysis. We first considered that we could characterize the activities by mesuring OD550 of the cultures after induction of IPTG. However, after preliminary experiments for determination of the measurement condition, we found some facts described below.
- Cultures induced the expression of λ lysis cassette becomes a kind of equilibrium state of cell lysis.
- R0011 is frequently mutated at 37 degrees if it regulates an expression of toxic gene because of natural selection.
- The possibility of mutation become low at 30 degrees, although it still remains a little.
Therefore, we made the following protocol that is suitable to our motivation.
- Pick out three colonies transformed with K358019 and cultivated in supplemented M9 media with certain concentration of IPTG. After incubation of 16h, 18h, 20h, measure OD550 of each culture.
We did the experiment as this protocol, we got the following data.
| Incubating | 16h | 18h | 20h | 16h | 18h | 20h | 16h | 18h | 20h |
|---|---|---|---|---|---|---|---|---|---|
| Number of colony | 1 | 1 | 1 | 2 | 2 | 2 | 3 | 3 | 3 |
| 0mM | 2.13 | 2.17 | 2.35 | 2.05 | 2.04 | 2.14 | 2.22 | 2.21 | 2.33 |
| 0.01mM | 2.02 | 2.01 | 2.15 | 1.96 | 2.23 | 2.23 | 2.21 | 2.07 | 2.29 |
| 0.02mM | 2.21 | 2.12 | 2.16 | 1.86 | 1.86 | 1.95 | 1.76 | 1.93 | 1.71 |
| 0.03mM | 1.44 | 1.41 | 1.39 | 1.70 | 1.62 | 1.59 | 0.82 | 1.02 | 0.83 |
| 0.05mM | 0.33 | 0.25 | 0.17 | 0.25 | 0.25 | 0.24 | 0.26 | 0.33 | 0.24 |
| 0.07mM | 0.15 | 0.17 | 0.23 | 0.21 | 0.20 | 0.23 | 0.18 | 0.18 | 0.19 |
| 0.1mM | 0.13 | 0.20 | 0.36 | 0.20 | 0.18 | 0.23 | 0.17 | 0.15 | 0.23 |
| 0.3mM | 0.10 | 0.21 | 0.31 | 0.08 | 0.11 | 0.14 | 0.11 | 0.07 | 0.20 |
| 0.5mM | 0.07 | 0.08 | 0.10 | 0.08 | 0.08 | 0.09 | 0.11 | 0.08 | 0.25 |
| 0.8mM | 0.25 | 0.10 | 0.08 | 0.29 | 0.22 | 0.11 | 0.18 | 0.22 | 0.10 |
| 1.0mM | 0.04 | 0.15 | 0.21 | 0.18 | 0.27 | 0.27 | 0.18 | 0.06 | 0.24 |
Table 1 OD550 of each culture incubated 16h, 18h, 20h, with various concentration of IPTG. The number of colony indicates which colony the cultures are drived from. The values of OD550 of 16h, 18h, 20h are derived from the same culture with certain concentration of IPTG.
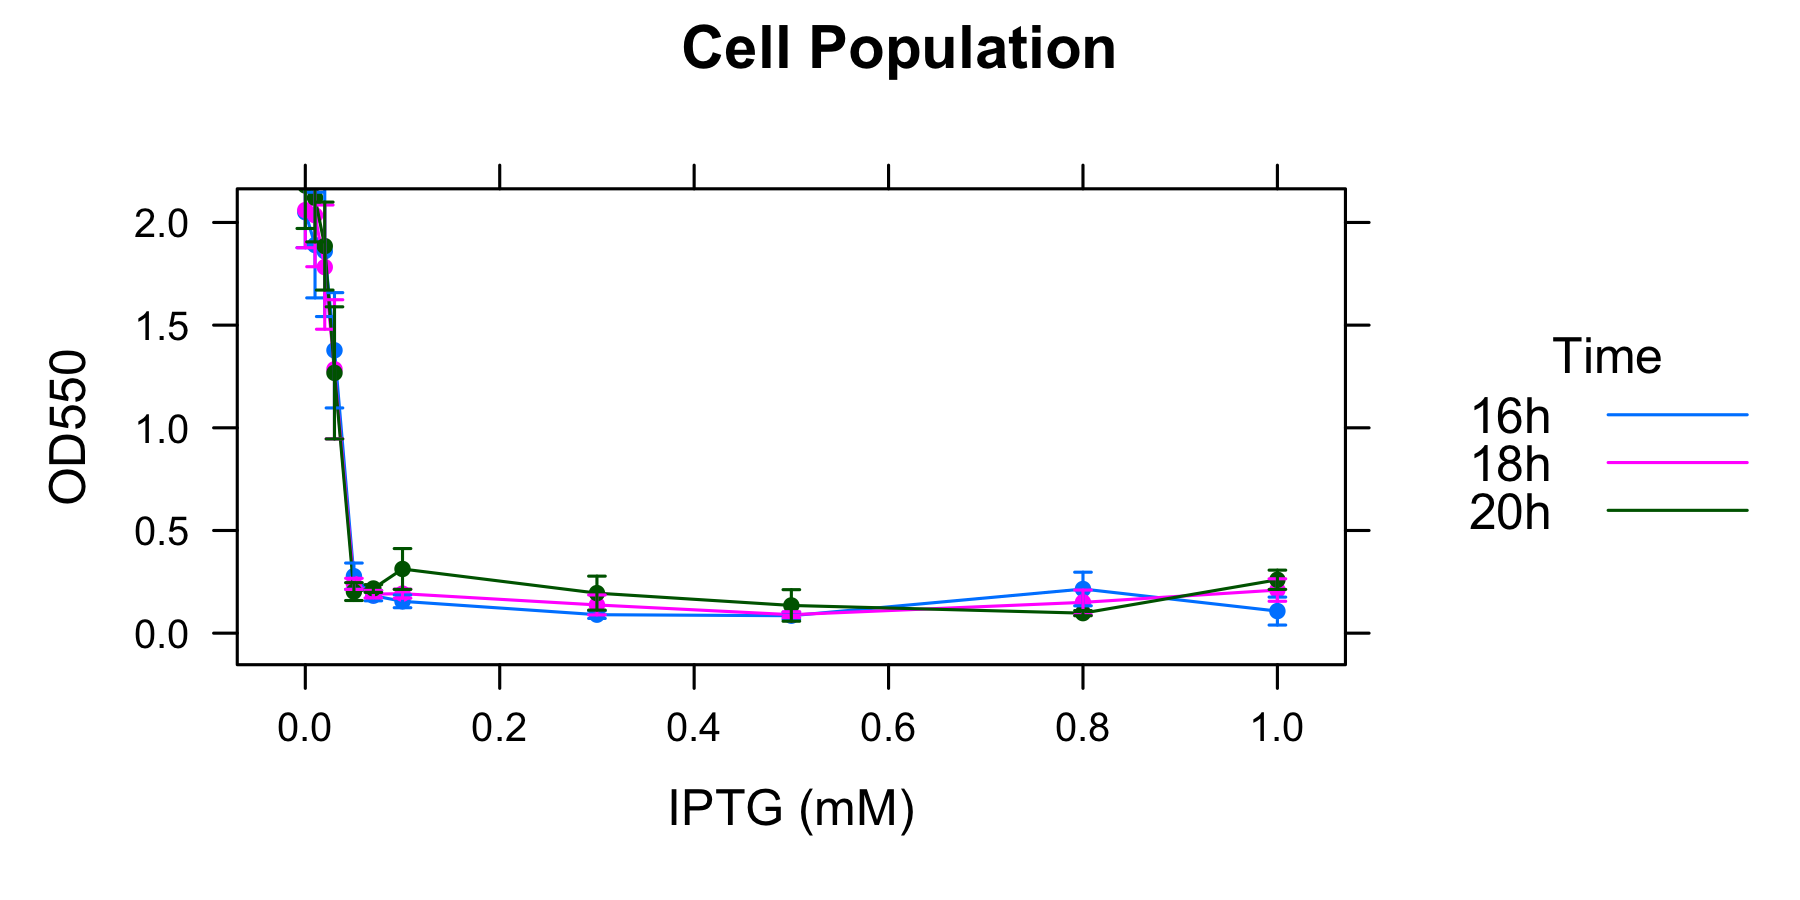
As Table1 shows, cell lysis seems to be an apparent equilibrium state. Exceptionally, OD550 increases from 16h to 20h when the concentration of IPTG is 0.8mM and 1.0mM. This exceptions seem to be mutated in the region of R0011, so we don't think about this). The value of OD550 in this state depends on the strength of induction of IPTG, thus we define it as LAV(Lytic Activity Value), which indicates the lytic activity of λ lysis cassette quantitatively.
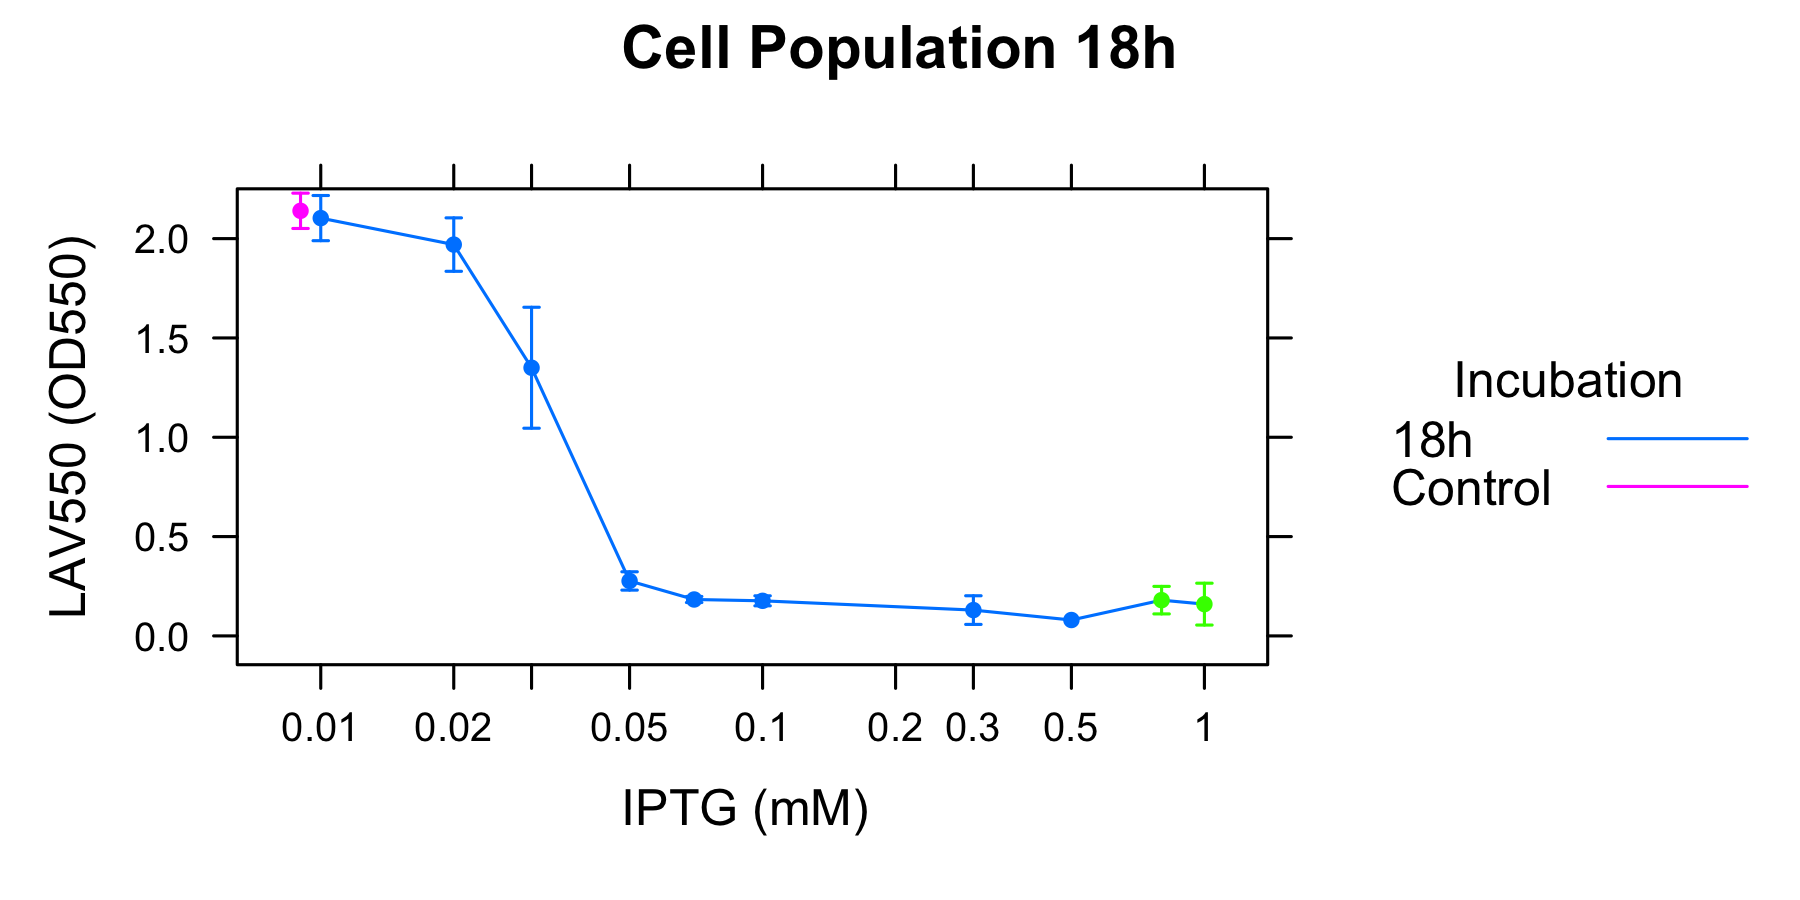
To analyze the relationship between the lytic activity of λ lysis cassette and RPU, we used the result of characterization of R0011.
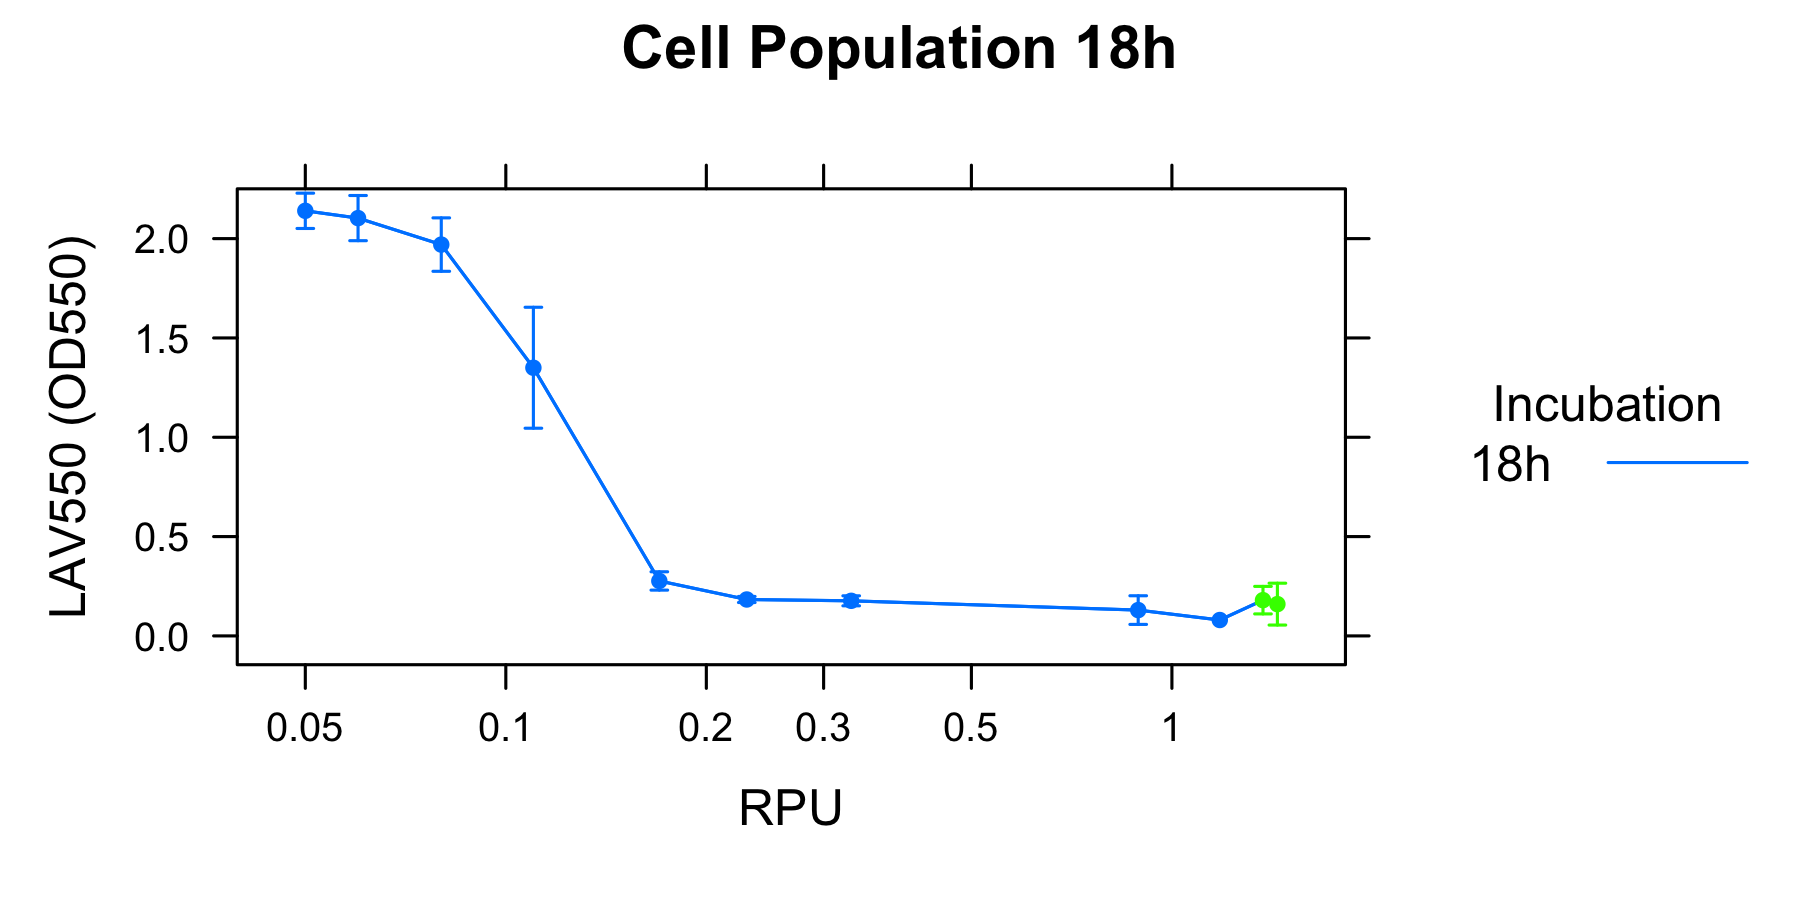
RPU is relative activity of promoter, so Fig. 2 shows the relationship between the lytic activity of λ lysis cassette and its expression level. The lysis cassette effectively induced cell lysis even when the expression was very repressed (0.2 RPU). Moreover, the activity of the cell lysis has a distinct threshold around 0.1 RPU. In case of the higher induction than 0.2 RPU, the cell populations reached a plateau but not zero.
Experiment 2: Measurement of lytic activity with time
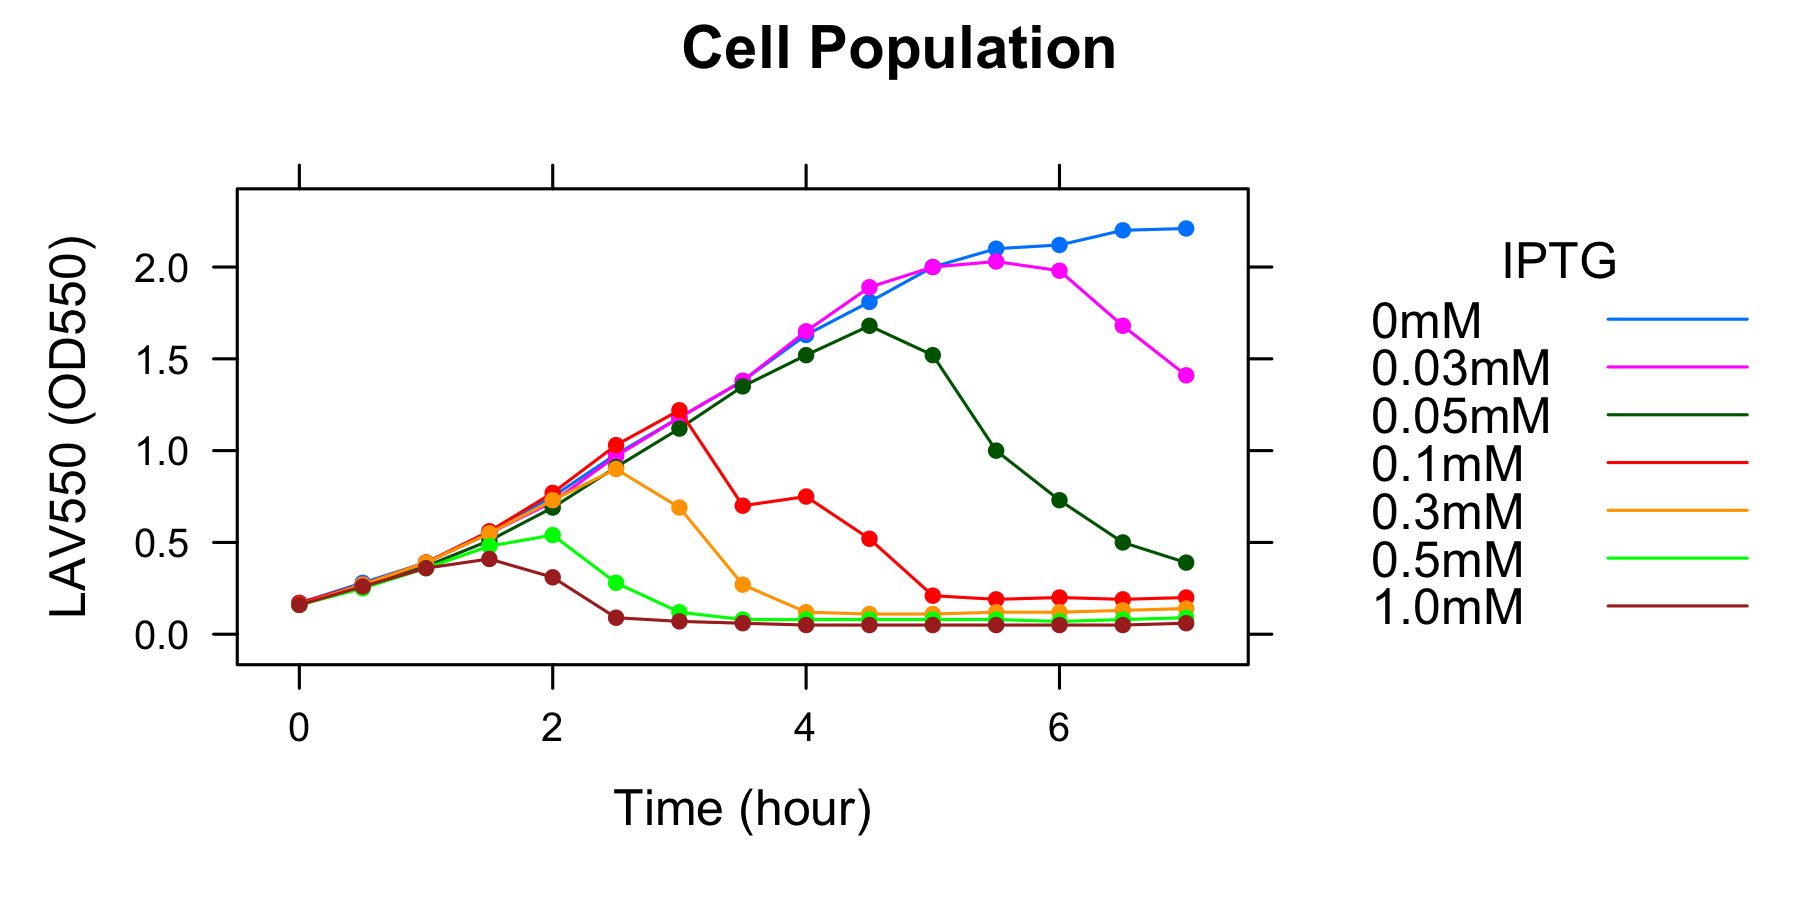
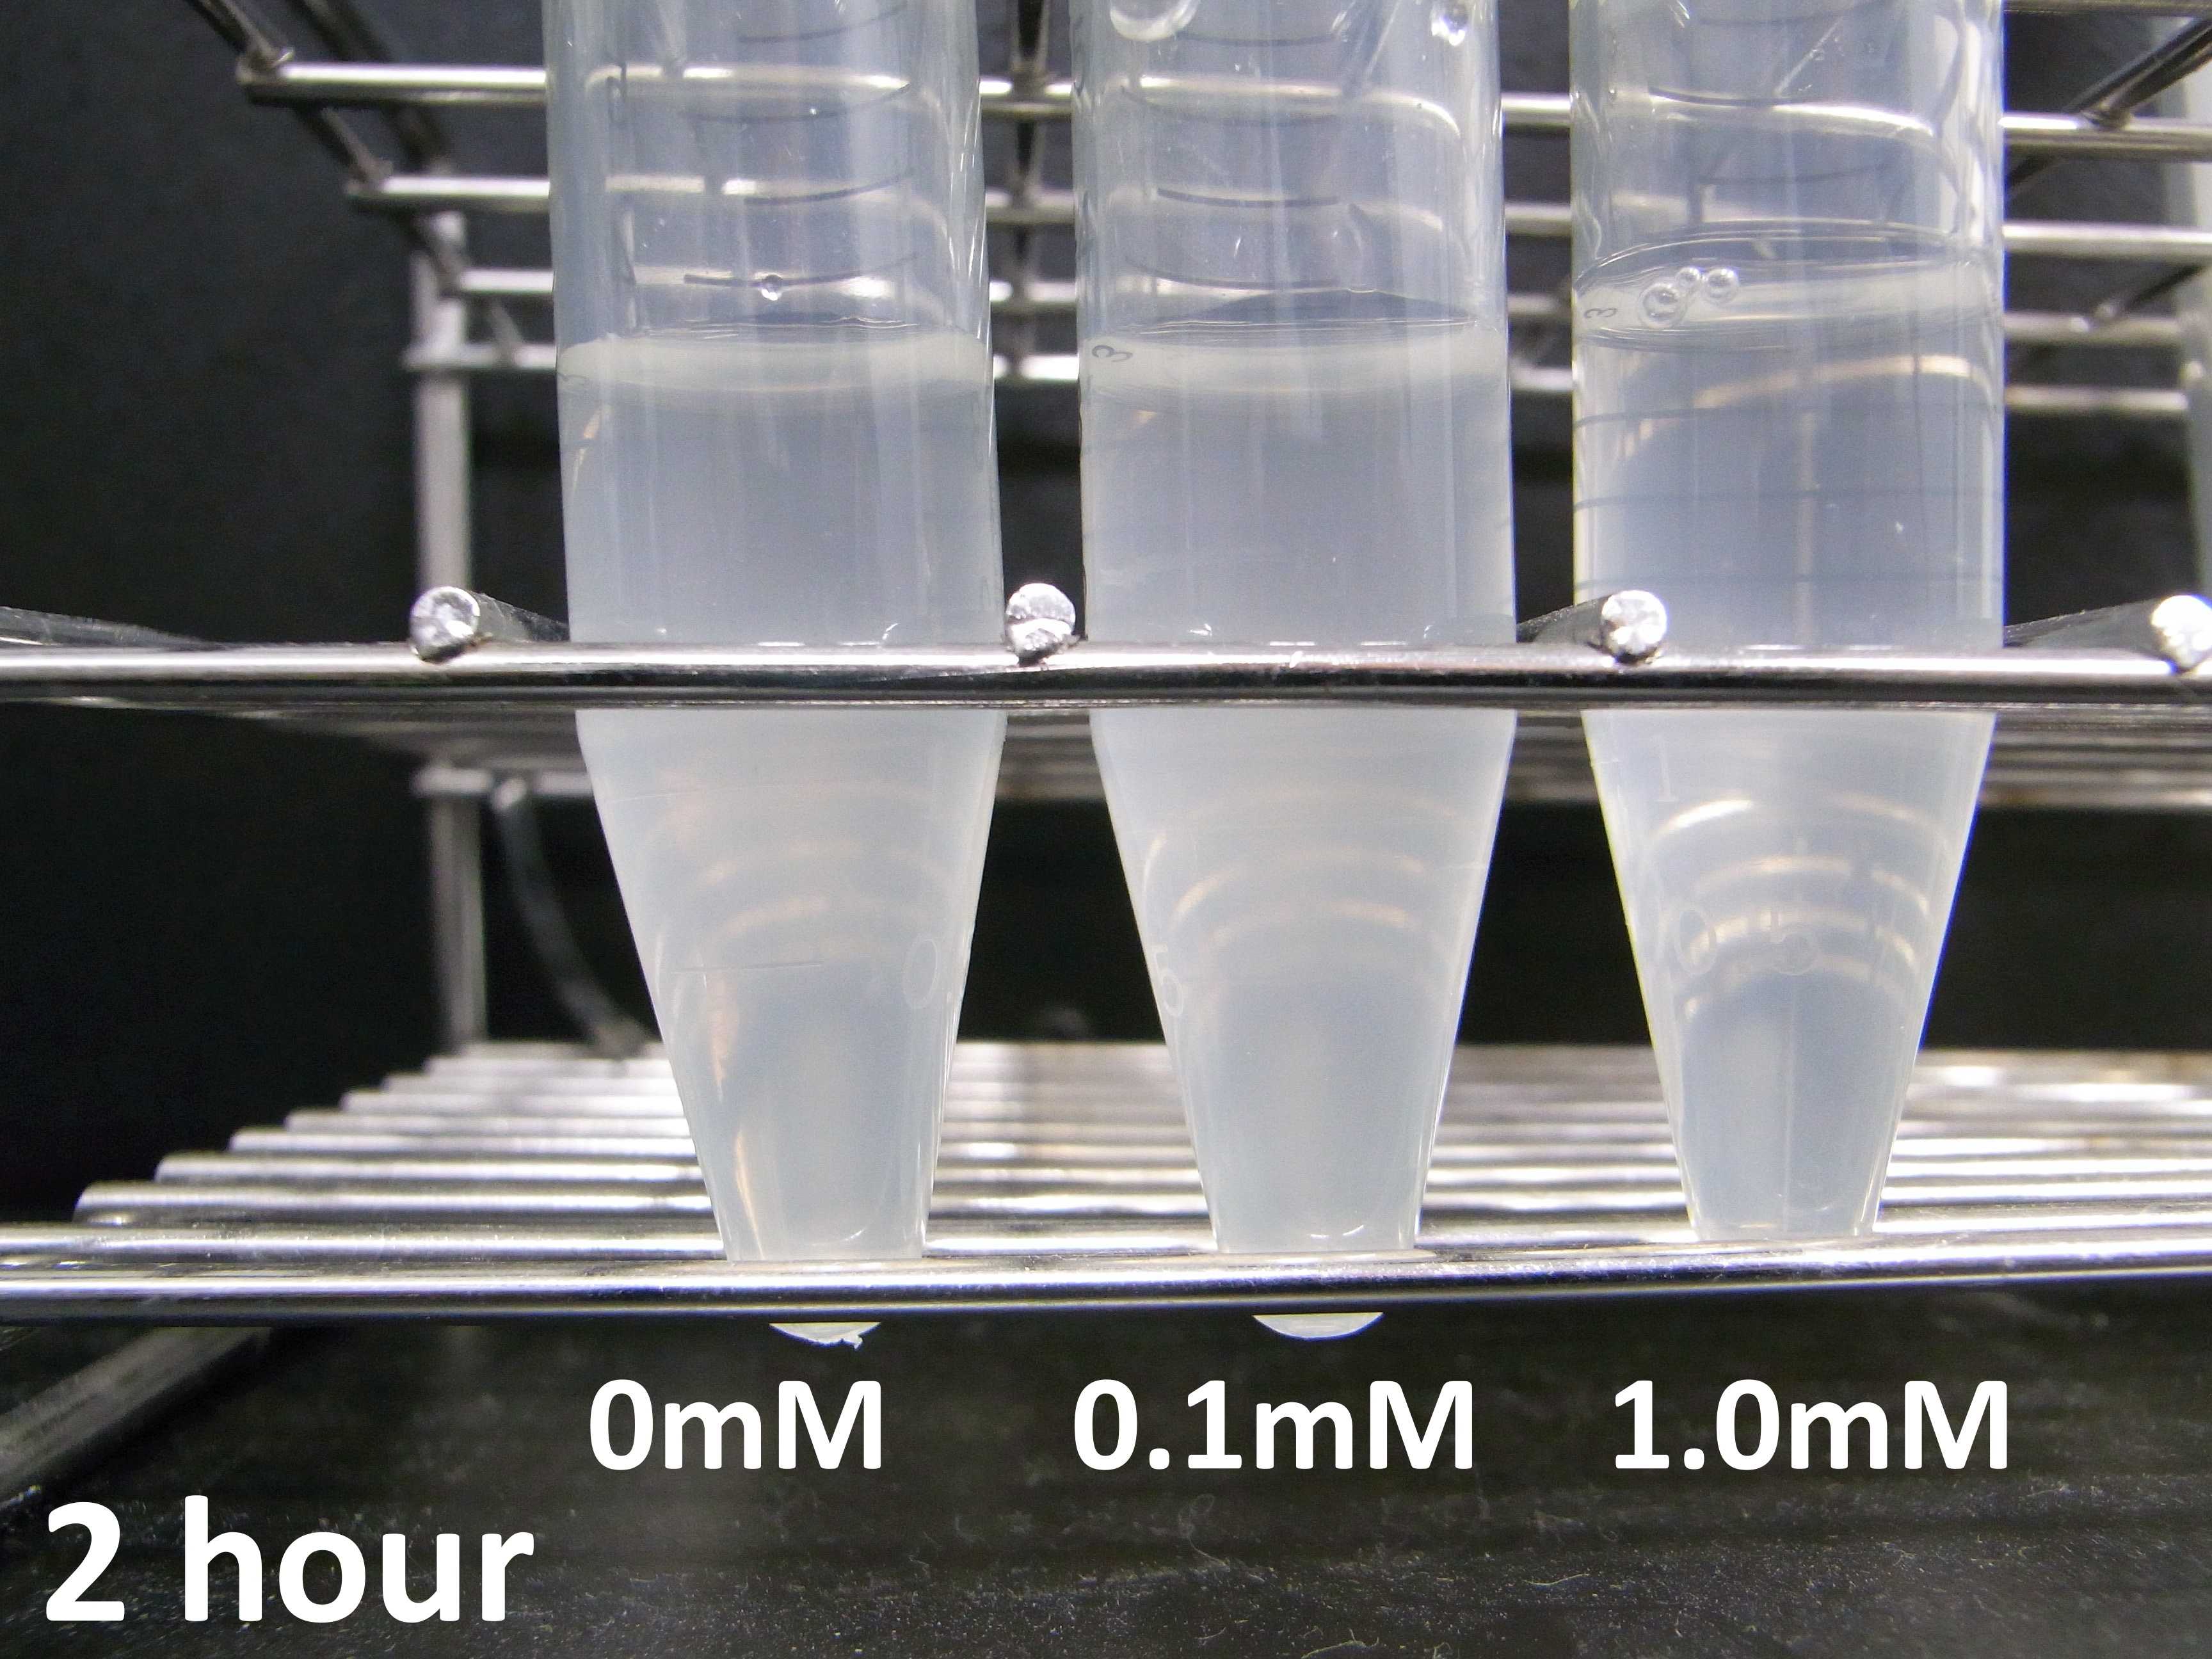
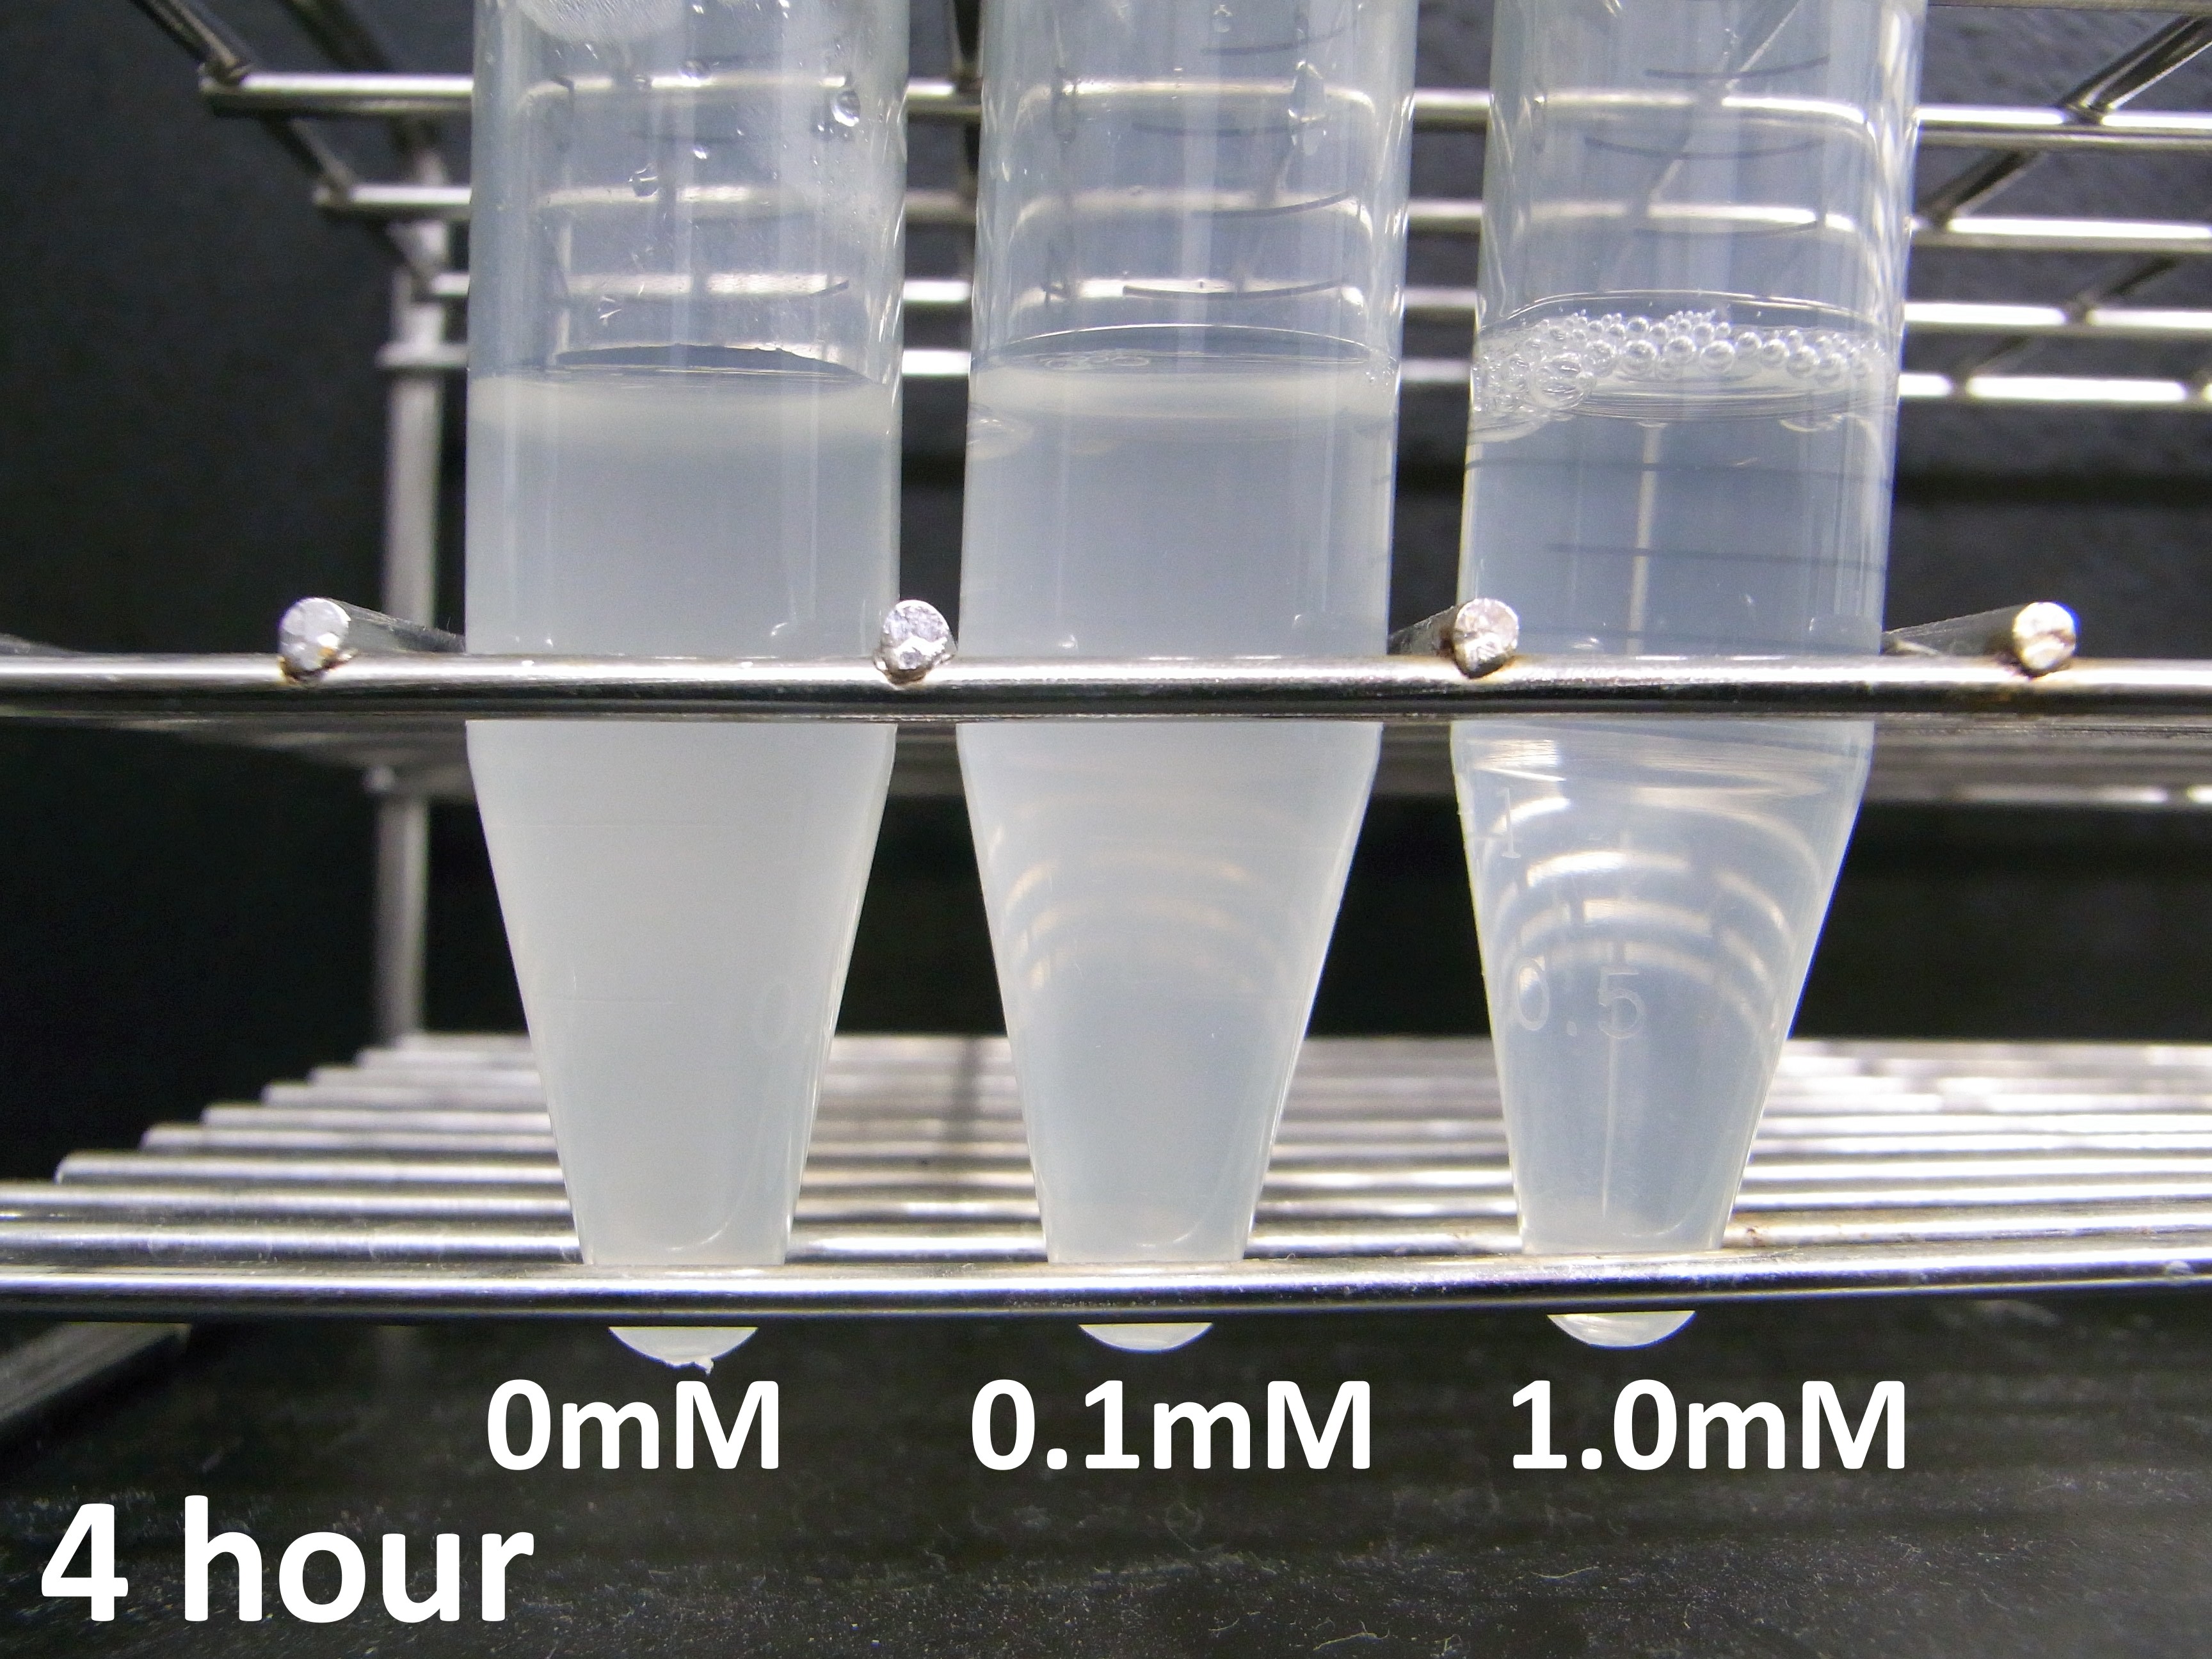
To characterize the lytic activity of λ lysis cassette in more detail, we focused on when cell lysis occurs after induction of IPTG. We did the experiment as this protocol, we got the following data
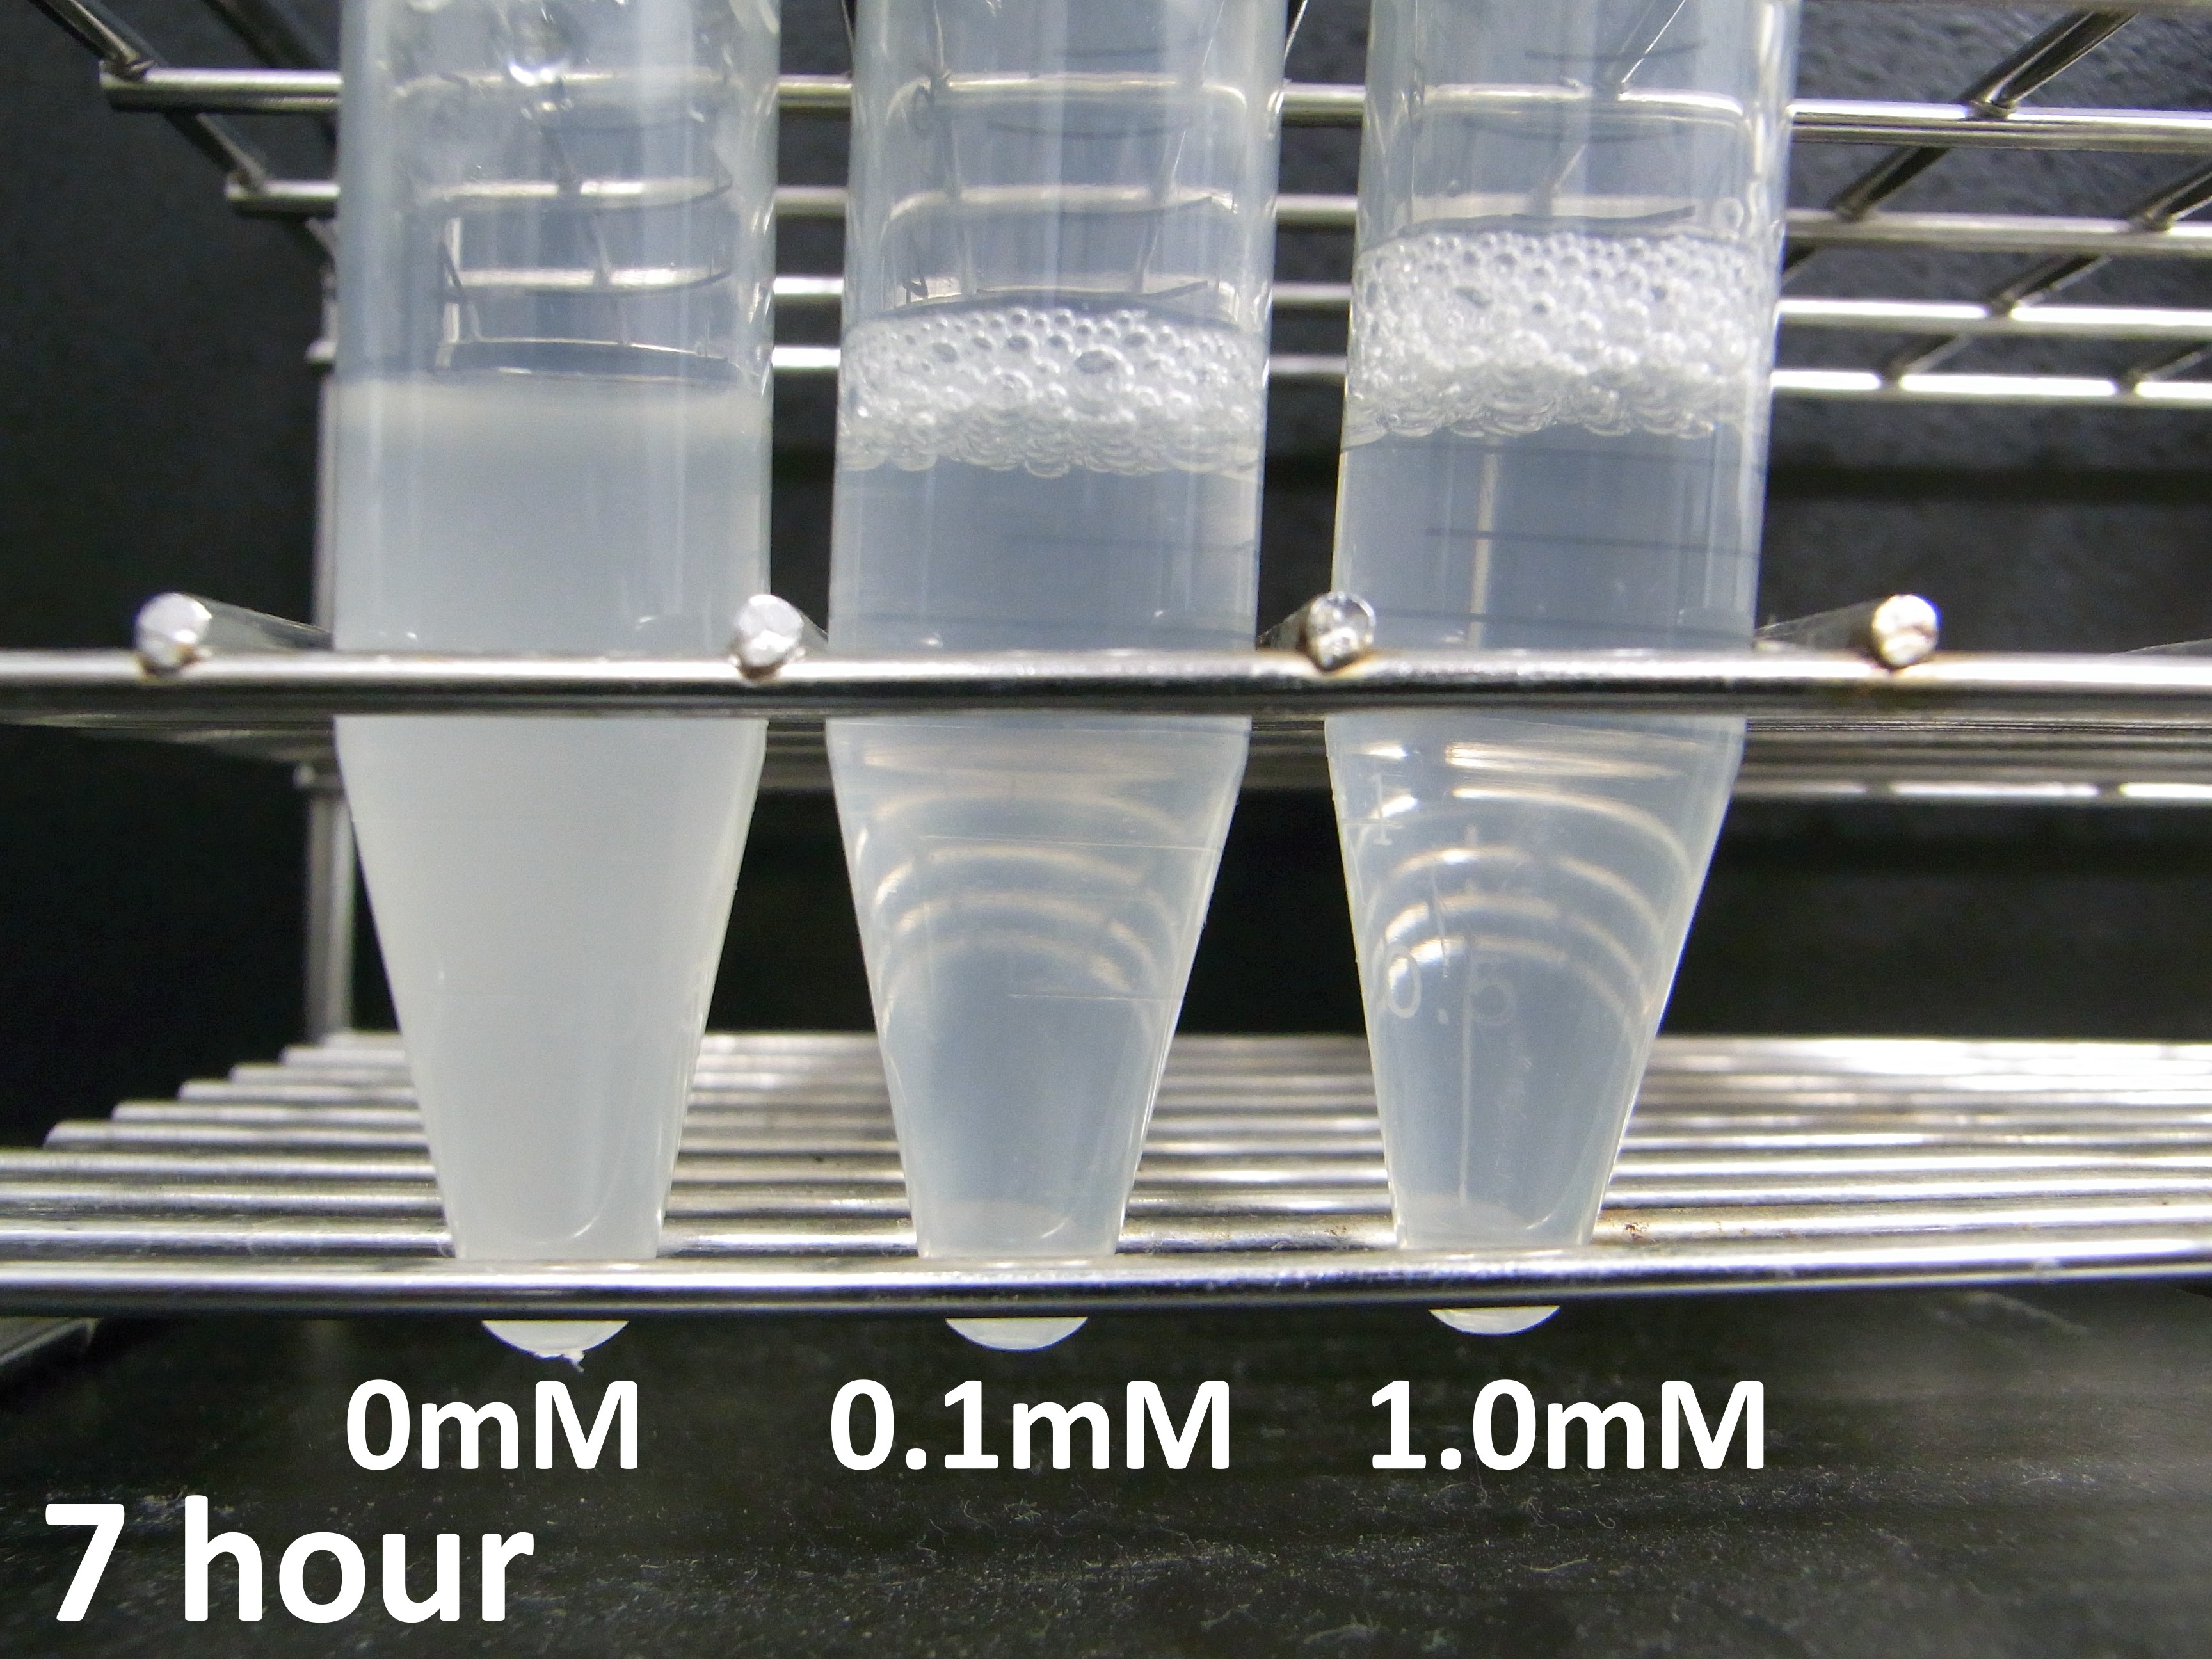
Please see our notebook. There is much data about the relationship between cell lysis and the concentration of IPTG.
Discussion
Apparent equilibrium state of cell lysis
We performed experiments for models of cell lysis using E.coli transformed with the construction, Plac and lysis cassette on the low copy plasmid. We measured A550 at 16h, 18h and 20h with various IPTG concentrations. Several stochastic models are considered from the unexpected results. Please refer to Modeling for further details.
Condition of promoters for λ lysis cassette
We characterized λ lysis cassette quantitatively with RPU. From our data, we determined a condition of activity of promoters. If you want to make inducible systems of cell lysis which use λ lysis cassete, the condition is as follows: the minimum activity is under 0.1 RPU and the maximum activity is over 0.2 RPU. Promoters that meet this condition can be applied to λ lysis cassette.
Initiation of cell lysis
We measured the time of Initiation of cell lysis for different concentration of IPTG. From our data, the higher concentration of IPTG is the earlier cell lyses. We can regulate the timing of initiation of cell lysis by controlling concentration of IPTG.
 "
"


