Team:Northwestern/Project/Modeling
From 2010.igem.org
(Difference between revisions)
(→Results) |
|||
| (17 intermediate revisions not shown) | |||
| Line 151: | Line 151: | ||
|- | |- | ||
|align="left" valign="top" width="80%" style="padding: 10"| | |align="left" valign="top" width="80%" style="padding: 10"| | ||
| - | =='''Objective'''== | + | =='''Introduction / Objective'''== |
| - | The | + | The general objective of our experimental system is to perform the following functions: |
| + | *Differentiate protein production between the top and bottom layer of the biofilm based on a diffusion-gradient inducer. | ||
| + | *Respond to varying Repressor production levels | ||
| + | *Respond to varying IPTG Induction levels | ||
| + | *Respond to varying Promoters | ||
| + | *Respond to varying Ribosome Binding Sites | ||
| + | *Respond to varying Copy Number Plasmids | ||
| - | + | The objective of our model is to explore and characterize the system, and the effect of parameter modulation on the system. | |
| - | + | ||
| - | + | ||
| - | + | ||
| - | + | ||
| - | + | ||
| - | + | ||
| - | + | In terms of our iGEM project, this model was employed to explore the effect of IPTG concentration and diffusion, lacI concentration (determined by the combination part of constitutive promoter, ribosome binding site, lacI gene, double terminator, lac promoter/operon), and the ribosome binding site (of the final product-producing enzyme) on the concentrations of all species involved - described in the following sections - and especially on Chitin Synthase and Chitin concentration and the corresponding rates. | |
| - | + | =='''Model Development'''== | |
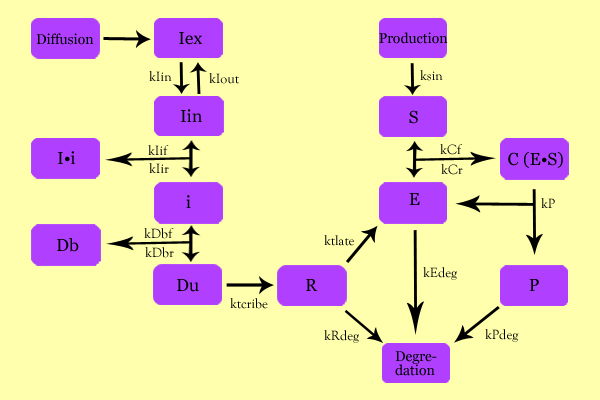
| - | + | The following schematic summarizes the mathematical model we formulated to describe our system. | |
[[Image:SuperModeling.jpg|600px|center]] | [[Image:SuperModeling.jpg|600px|center]] | ||
| Line 186: | Line 186: | ||
* C: Enzyme Substrate Complex (CHS3-(N-Acetyl-Glucosamine)-Chitin or (NAG)n Complex) | * C: Enzyme Substrate Complex (CHS3-(N-Acetyl-Glucosamine)-Chitin or (NAG)n Complex) | ||
* P: Protein Product (Chitin or (NAG)n+1) | * P: Protein Product (Chitin or (NAG)n+1) | ||
| + | |||
| + | |||
| + | ==='''Constants'''=== | ||
| + | |||
| + | Rate Constants: | ||
| + | |||
| + | * kIin - Inducer diffusion into cell from surrounding environment | ||
| + | * kIout - Inducer diffusion out of cell to surrounding environment | ||
| + | * kIif - Inducer and Repressor binding to form Inducer-Repressor Complex | ||
| + | * kIir - Inducer-Repressor Complex unbinding to form Inducer and Repressor | ||
| + | * kDbf - Repressor binding to DNA to form DNA-Repressor Complex | ||
| + | * kDbr - DNA-Repressor Complex unbinding to form free unbound DNA | ||
| + | * ktcribe - transcription | ||
| + | * ktlate - translation | ||
| + | * ksin - endogenous substrate production | ||
| + | * kCf - Substrate-Enzyme Complex Formation | ||
| + | * kCr - Substrate-Enzyme Complex unbinding to form Substrate and Enzyme | ||
| + | * kP - Substrate-Enzyme Complex forming Product and Enzyme | ||
| + | * kEdeg - Enzyme Degredation | ||
| + | * kRdeg - RNA Degredation | ||
| + | * kPdeg - Protein Degredation | ||
| Line 192: | Line 213: | ||
The differential of the variables were found as follows: | The differential of the variables were found as follows: | ||
| - | * dIin = kIin*Iex - kIex*Iin + kIir*Ii - kIif*Iin*i | + | * dIin/dt = kIin*Iex - kIex*Iin + kIir*Ii - kIif*Iin*i |
| - | * dIi = kIif*Iin*i - kIir*Ii | + | * dIi/dt = kIif*Iin*i - kIir*Ii |
| - | * di = kIir*Ii - kIif*Iin*i + kDbr*Db - kDbf*i*Dunb | + | * di/dt = kIir*Ii - kIif*Iin*i + kDbr*Db - kDbf*i*Dunb |
| - | * dDb = kDbf*i*Dunb - kDbr*Db | + | * dDb/dt = kDbf*i*Dunb - kDbr*Db |
| - | * dDunb = kDbr*Db - kDbf*i*Dunb | + | * dDunb/dt = kDbr*Db - kDbf*i*Dunb |
| - | * dRe = ktscribe*Dunb - kRdeg*Re | + | * dRe/dt = ktscribe*Dunb - kRdeg*Re |
| - | * dE = ktslate*Re - kEdeg*E + kCr*CC + kP*CC - kCf*E*Si | + | * dE/dt = ktslate*Re - kEdeg*E + kCr*CC + kP*CC - kCf*E*Si |
| - | * dSi = ksin*So - kCf*E*Si + kCr*CC | + | * dSi/dt = ksin*So - kCf*E*Si + kCr*CC |
| - | * dCC = kCf*E*Si - kCr*CC - kP*CC | + | * dCC/dt = kCf*E*Si - kCr*CC - kP*CC |
| - | * dP = kP*CC - kPdeg*P | + | * dP/dt = kP*CC - kPdeg*P |
| - | ===''' | + | ==='''Assumptions'''=== |
| + | |||
| + | In order to determine the initial or steady state concentrations of the involved species and to determine the rate constants, the following assumptions were made: | ||
| + | |||
| + | |||
| + | '''IPTG Diffusion''' | ||
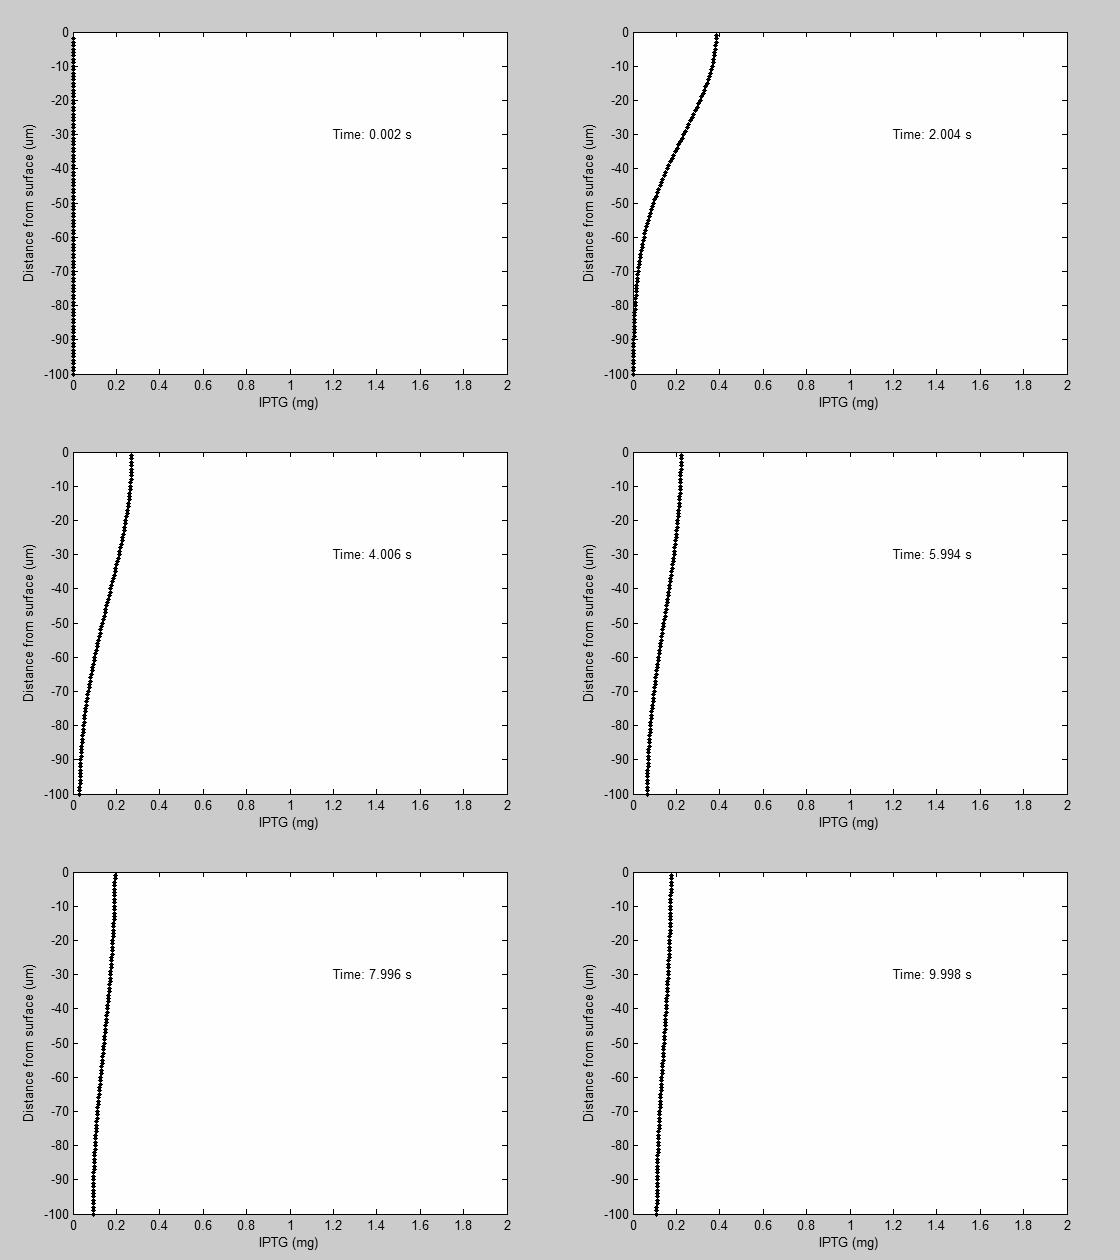
First, Fick's Law of Diffusion was modeled through MATLAB. The diffusion constant used was 220um^2/s.[4] | First, Fick's Law of Diffusion was modeled through MATLAB. The diffusion constant used was 220um^2/s.[4] | ||
| + | |||
| + | It was assumed that IPTG was not consumed nor degraded | ||
| + | |||
| + | We also assumed that IPTG uptake was minor was compared to the concentration in the biofilm, and so that the external IPTG was determined solely by Fick's Law, not by internalization. | ||
| + | |||
| + | |||
| + | '''Constant Determination''' | ||
| + | |||
| + | Initially, the following initial concentration values were assumed: | ||
| + | |||
| + | * Iex: Described in the previous section | ||
| + | * Iin: Internal IPTG initially assumed to be 0 | ||
| + | * Ii: 0, because no IPTG means IPTG-repressor complex | ||
| + | * i: Value acquired from [5] as between 10^-5 and 10^-4 and adjusted to 9.973*10^-5 | ||
| + | * Db: Calculated, knowing the expression vector is a 200 copy number plasmid; of the DNA, approximated that 90.08% is bound | ||
| + | * Dunb: Calculated, knowing the expression vector is a 200 copy number plasmid; of the DNA, approximated that 9.92% is bound | ||
| + | * Re: Determined to be 1.82735*10^-4 by achieving steady state with the model | ||
| + | * E: Determined to be 6.08*10^-4 by achieving steady state with the model | ||
| + | * So: External Substrate calculated by using amount added in enriched media as 33.9 | ||
| + | * Si: Determined from [3] to be 10^-1 | ||
| + | * C: Determined to be 3*10^-5by achieving steady state with the model | ||
| + | * P: Determined to be 1*10^-4 by achieving steady state with the model | ||
| + | |||
| + | The rate constant values were assumed to be the following: | ||
| + | |||
| + | * kIin: .05 yielded reasonable diffusion times | ||
| + | * kIex: .05 since simple diffusion, the internal rate constant must be similar if not identical to the external rate constant | ||
| + | * kIif: .01 yielded reasonable repressor/Inducer interactions | ||
| + | * kIir: .01 yielded reasonable repressor/Inducer interactions | ||
| + | * kDbf: 100 yielded reasonable DNA/repressor interactions | ||
| + | * kDbr: .0011 yielded reasonable DNA/repressor interactions | ||
| + | * ktscribe: .01 yielded reasonable production levels | ||
| + | * ktslate: .01 yielded reasonable production levels | ||
| + | * kRdeg: .003 yielded reasonable degredation | ||
| + | * kEdeg: .003 yielded reasonable degredation | ||
| + | * kPdeg: .003 yielded reasonable degredation | ||
| + | * ksin: 0.000000009 yielded reasonable internalization of substrate | ||
| + | * kCf: .01 yielded reasonable production levels | ||
| + | * kCr: .01 yielded reasonable production levels | ||
| + | * kP: .01 yielded reasonable production levels | ||
| + | |||
| + | =='''Results'''== | ||
| + | |||
| + | ==='''1. IPTG Diffusion'''=== | ||
| + | |||
| + | First, in order to determine the diffusion of IPTG when applied (sprayed) at the top layer throughout the biofilm, Fick's Diffusion equation was used to create a finite-time-differential mathematical model, which is graphically displayed below. | ||
[[Image:loopydoops.gif]] | [[Image:loopydoops.gif]] | ||
| - | + | Once sprayed, the model predicts that the IPTG diffuses down the biofilm and stabilizes throughout the biofilm layer. | |
| - | |||
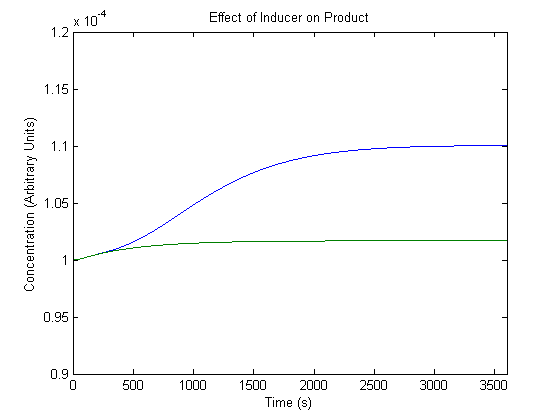
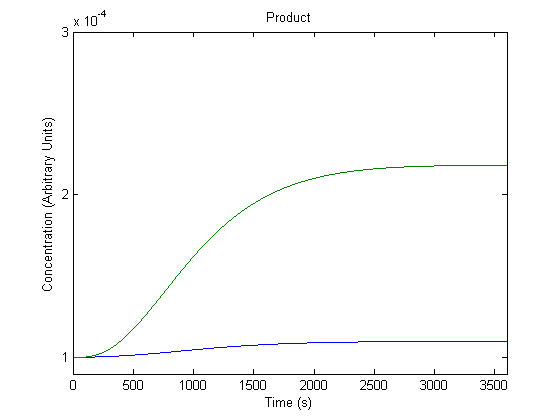
| - | + | ==='''2. Effect of Inducer on Product Generation'''=== | |
| - | + | As inducer levels are easily experimentally adjustable, we wanted to know the effect of the adjustment. | |
| - | + | [[Image:NUigemmodeling1.jpg]] | |
| - | + | In the figure, the blue line represents product levels when induced and the green line represents product levels when not induced. | |
| - | + | As shown above, the model predicts that induction leads to higher product levels. | |
| - | |||
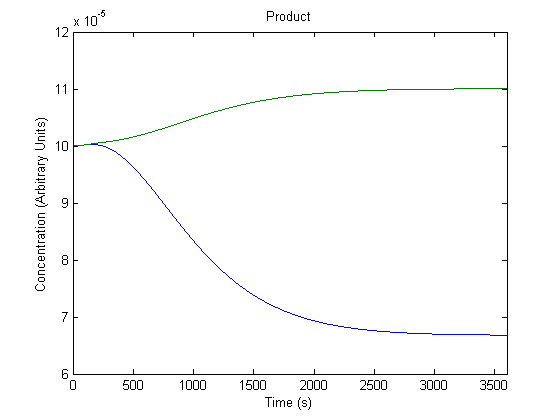
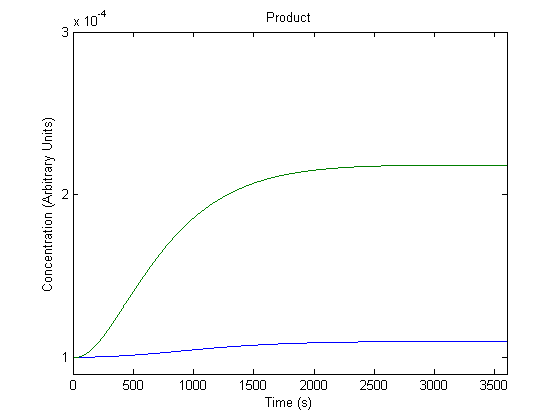
| - | + | ==='''3. Effect of Repressor on Product Generation'''=== | |
| - | + | Repressor levels are also experimentally adjustable by changing the repressor producing segment of the part, and so we wanted to know the effect of the adjustment. | |
| - | + | [[Image:NUigemmodeling2.jpg]] | |
| - | + | In the figure above, the green line represents product levels with the assumed repressor level and the blue line represents product levels when the repressor level is doubled. | |
| - | + | ||
| - | + | ||
| - | + | ||
| - | + | ||
| - | + | ||
| - | + | ||
| - | + | ||
| - | + | ||
| - | + | ||
| - | + | ||
| - | + | ||
| - | + | ||
| - | + | ||
| - | + | ||
| - | + | ||
| - | + | ||
| - | + | ||
| - | + | ||
| - | + | ||
| - | + | ||
| - | + | ||
| - | + | ||
| - | + | ||
| - | + | ||
| - | + | ||
| + | The figure is a bit misleading, as a system with different repressor levels will have a different initial steady state. Regardless, the model predicts that more repressor leads to significantly less product. | ||
| - | |||
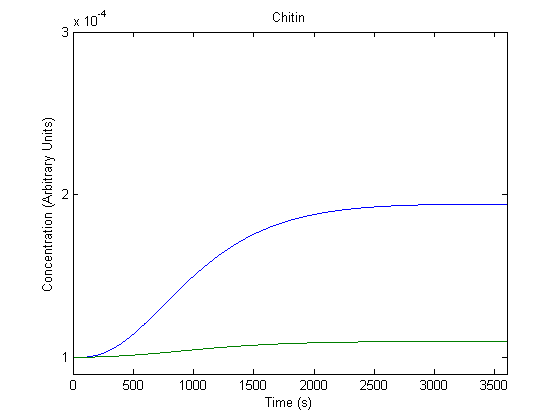
| - | + | ==='''4. Effect of Promoter on Product Generation'''=== | |
| - | + | The promoter preceding the gene can be changed to different promoters, and we wanted to know the effect of this adjustment. | |
| - | + | ||
| - | + | ||
| - | + | ||
| + | [[Image:NUigemmodeling3.jpg]] | ||
| - | + | In the figure above, the blue line represents product with the assumed rate constant for transcription (which would be affected by the promoter) and the green line represents product when that value is doubled. | |
| - | + | As shown above, the model predicts that a more efficient promoter would increase product production. | |
| - | + | ==='''5. Effect of Ribosome Binding Site on Product Generation'''=== | |
| - | + | ||
| - | + | The Ribosome Binding Site preceding the gene can be changed to different Ribosome Binding Sites, and we wanted to know the effect of this adjustment. | |
| - | + | ||
| - | + | [[Image:NUigemmodeling4.jpg]] | |
| - | * | + | |
| + | In the figure above, the green line represents product with the assumed rate constant for translation (which would be affected by the ribosome binding site) and the blue line represents product when that value is doubled. | ||
| + | |||
| + | As shown above, the model predicts that a more efficient ribosome binding site would increase product production. | ||
| + | |||
| + | ==='''6. Effect of DNA Copy Number on Product Generation'''=== | ||
| + | |||
| + | The DNA part could be ligated into a different plasmids with varying copy numbers; we wanted to know the effect of this adjustment. | ||
| + | |||
| + | [[Image:NUigemmodeling5.jpg]] | ||
| + | |||
| + | In the figure above, the blue line represents product with the assumed DNA concentration value (which would be affected by the plasmid copy number) and the green line represents product when that value is doubled. | ||
| + | |||
| + | As shown above, the model predicts that varying copy numbers would vary product production. | ||
| + | |||
| + | =='''Future Considerations'''== | ||
| + | |||
| + | Although the this model, as shown, captures the topology of our engineered network, its predictive prowess can be improved by obtaining constants and parameters from empirical observations. | ||
| + | |||
| + | In acquiring data, using the actual Chitin vector would be most helpful, but if not viable, then an alternative method is to characterize the system using GFP instead of CHS3 and fluorescence as an indicator of product generation. The resulting data could be used to fit the parameters of the model. | ||
| + | |||
| + | Possible future work: | ||
| + | |||
| + | *Currently the model predicts the final product expression level between the top layer and bottom layer of a gradient-induced system as only about 0.00001%. Determine if this is primarily due to model inaccuracy or the inefficacy of diffusion-based layer differential induction method. | ||
| + | *Currently the model only predicts only a 10% increase in product when induced by what is suspected to be a significant concentration of inducer. | ||
| + | *The model assumes constant substrate production rate; this assumption may or may not be accurate. | ||
| Line 326: | Line 394: | ||
=='''MATLAB m-file'''== | =='''MATLAB m-file'''== | ||
| + | <html> | ||
| + | %IPTG PREDETERMINATION</br> | ||
| + | %finite difference method</br> | ||
| + | %diffusion equation (Fick's 2nd Law)</br> | ||
| + | %c=c0*(erfc*x/sqrt(2*D*t))</br> | ||
| + | %D*(Ci+1-2C+Ci-1)/dx^2 = Ci/dt</br> | ||
| + | %x goes from 0 (top) to 100 micrometers</br> | ||
| + | </br> | ||
| + | %D=IPTG is a modified monosaccharide, so we can estimate from Table 1 that</br> | ||
| + | %its diffusion coefficient in water at 25°C will be ca. 6.5 × 10?6 cm2 s?1.</br> | ||
| + | %Scaling to 37°C and taking De/Daq to be 0.25, De is found to be 2.2 × 10?6 cm2 s?1</br> | ||
| + | %http://www.ncbi.nlm.nih.gov/pmc/articles/PMC148055/</br> | ||
| + | </br> | ||
| + | %%</br> | ||
| + | clear</br> | ||
| + | clc</br> | ||
| + | %INITIALIZE</br> | ||
| + | D=220; %um^2/s</br> | ||
| + | c0=14.298; %mg so 3ml spray of 20mM iptg</br> | ||
| + | %in comparison 23.83mg of iptg is in 5ml 20mM</br> | ||
| + | dx=1; %um</br> | ||
| + | xmax=100; %um; 100um total</br> | ||
| + | dt=.002; %s</br> | ||
| + | tmax=10; %s; 1 hour total</br> | ||
| + | C=zeros(xmax/dx,tmax/dt); %rows = same time %also, (x,t) x is row, t is column</br> | ||
| + | C_Rate=zeros(xmax/dt,1);</br> | ||
| + | C(1,1)=c0;</br> | ||
| + | %Time Step</br> | ||
| + | for t=1:1:tmax/dt-1; %s</br> | ||
| + | for x=1:1:(xmax/dx) %um</br> | ||
| + | if x==1%account for x=1 boundary condition</br> | ||
| + | C_Rate(x)=D*(C(x+1,t)-C(x,t))/(dx^2);</br> | ||
| + | elseif x==xmax/dx %account for x=xmax boundary condition</br> | ||
| + | C_Rate(x)=D*(C(x-1,t)-C(x,t))/(dx^2);</br> | ||
| + | else%BULK</br> | ||
| + | C_Rate(x)=D*(C(x-1,t)+C(x+1,t)-2*C(x,t))/(dx^2);</br> | ||
| + | end</br> | ||
| + | C(x,t+1)=C(x,t)+C_Rate(x)*dt;</br> | ||
| + | end</br> | ||
| + | t*.002</br> | ||
| + | end</br> | ||
| + | %%</br> | ||
| + | %Compile into 1s parts</br> | ||
| + | %newC=zeros(100,tmax/dt/500);</br> | ||
| + | counts=1;</br> | ||
| + | for t=1:500:tmax/dt-1 %.002*x=1;</br> | ||
| + | newC(:,counts)=C(:,t);</br> | ||
| + | counts=counts+1;</br> | ||
| + | end</br> | ||
| + | %%</br> | ||
| + | %visualize newC</br> | ||
| + | for t=1:1:tmax/dt/500</br> | ||
| + | XX=0:dx:xmax-dx;</br> | ||
| + | YY=newC(:,t);</br> | ||
| + | plot(XX,YY,'k.');</br> | ||
| + | axis([0 100 0 2])</br> | ||
| + | text(50,1.8,sprintf('Time is: %g s', t*dt));</br> | ||
| + | text(50,1.7,sprintf('IPTG Mass balance is: %g mg', sum(C(:,t))));</br> | ||
| + | xlabel('Distance from surface (um)')</br> | ||
| + | ylabel('IPTG (mg)')</br> | ||
| + | Mov(t)=getframe();</br> | ||
| + | %pause(1);</br> | ||
| + | end</br> | ||
| + | %%</br> | ||
| + | </br> | ||
| + | %VISUALIZE</br> | ||
| + | blah=1;</br> | ||
| + | for t=1:7:tmax/dt</br> | ||
| + | XX=xmax-dx-100:-dx:0-100;</br> | ||
| + | YY=C(:,t);</br> | ||
| + | plot(YY,XX,'k.');</br> | ||
| + | axis([0 2 -100 0])</br> | ||
| + | text(1.2,-30,sprintf('Time: %g s', t*dt));</br> | ||
| + | %text(50,1.7,sprintf('IPTG Mass balance is: %g mg', sum(C(:,t))));</br> | ||
| + | ylabel('Distance from surface (um)')</br> | ||
| + | xlabel('IPTG (mg)')</br> | ||
| + | VID(blah)=getframe(gcf);</br> | ||
| + | blah=blah+1;</br> | ||
| + | end</br> | ||
| + | </br> | ||
| + | </html> | ||
| - | % | + | <html> |
| - | % | + | </br> |
| - | % | + | % Updated kinetics model</br> |
| - | % | + | %{</br> |
| - | % | + | Iex - external inducer or iptg</br> |
| - | % | + | Iin - internal inducer or iptg</br> |
| - | + | Ii - lac inhibitor / iptg complex</br> | |
| - | % | + | i - lac inhibitor</br> |
| - | % | + | Db - DNA bound to inhibitor</br> |
| - | % | + | Dunb - DNA not bound to inhibitor</br> |
| - | %http://www.ncbi.nlm.nih.gov/pmc/articles/ | + | R - mRNA</br> |
| - | + | E - Enzyme Chitin Synthase</br> | |
| - | % | + | So - External Substrate - N-Acetyl Glucosamine</br> |
| - | + | Si - Internal Substrate - N-Acetyl Glucosamine</br> | |
| - | + | CC - Enzyme Substrate Complex</br> | |
| - | % | + | P - Protein - Chitin</br> |
| - | + | %}</br> | |
| - | + | dt=1;</br> | |
| - | + | tmax=3600;</br> | |
| - | + | dx=1;</br> | |
| - | + | xmax=100;</br> | |
| - | + | %General Array Structure: (Depth (um), Time (s))</br> | |
| - | + | %Depth = 0-100 micrometers</br> | |
| - | + | %Time = 0- 3600 seconds</br> | |
| - | + | preset=zeros(xmax,tmax);</br> | |
| - | + | Iin=preset;Ii=preset;i=preset;Db=preset;Dunb=preset;Re=preset;E=preset;Si=preset;CC=preset;P=preset;</br> | |
| - | %Time | + | </br> |
| - | for | + | %initial concentration</br> |
| - | for | + | a=load('newC.mat'); %Iex is diff - assume cell intake << exist</br> |
| - | + | Iex=zeros(100,3600);%a.newC();%</br> | |
| - | + | Iin(:,1)=0; %initially IPTG inside the cell is 0</br> | |
| - | + | Ii(:,1)=0; %no iptg, no Ii</br> | |
| - | + | i(:,1)=0.9973*10^-4; %10^-7 to 10^-8 M which is 10^-4 to 10^5 mM http://www.ncbi.nlm.nih.gov/pmc/articles/PMC245824/pdf/jbacter00335-0105.pdf</br> | |
| - | + | %DNA - partsregistry - 200 copy number - 200/(6.23*10^-23)/(6*10^-16</br> | |
| - | + | %volume)*1000 = 5.53*10^-4mM</br> | |
| - | + | dper=0.9008;</br> | |
| - | + | Db(:,1)=5.53*dper*10^-4; %say 90% is bound no idea</br> | |
| - | + | Dunb(:,1)=5.53*(1-dper)*10^-4; %say 10% unbound no idea</br> | |
| - | + | Re(:,1)=1.82735*10^-4; %initially, no RNA </br> | |
| - | + | E(:,1)=6.08*10^-4; %initially no enzyme</br> | |
| - | + | So=33.9; %1 pill per plate ~ 750mg/100ml /221.21g/mol /1000*1000*1000 is 33.9mM</br> | |
| - | + | Si(:,1)=10^-1; %http://www.ncbi.nlm.nih.gov/pmc/articles/PMC217602/pdf/jbacter00247-0262.pdf</br> | |
| - | + | CC(:,1)=3*10^-5; %initially 0</br> | |
| - | + | P(:,1)=1*10^-4; %initially 0</br> | |
| - | + | </br> | |
| - | + | %rate constants</br> | |
| - | + | kIin=.05;%safe to say diffuses within minutes</br> | |
| - | + | kIex=.05;%permeability must be similar</br> | |
| - | + | kIif=.01;</br> | |
| - | + | kIir=.01;</br> | |
| - | + | kDbf=100;</br> | |
| - | + | kDbr=.0011;</br> | |
| - | + | ktscribe=.01;</br> | |
| - | + | ktslate=.01;</br> | |
| - | + | kRdeg=.003;</br> | |
| - | + | kEdeg=.003;</br> | |
| - | + | kPdeg=.003;</br> | |
| - | + | ksin=0.000000009;</br> | |
| - | + | kCf=.01;</br> | |
| - | + | kCr=.01;</br> | |
| - | % | + | kP=.01;</br> |
| - | + | </br> | |
| - | + | %Begin Loop</br> | |
| - | + | %FILL IN THE BLANKS</br> | |
| - | + | %General Array Structure: (Depth (um), Time (s))</br> | |
| - | + | for tt=1:1:tmax/dt-1</br> | |
| - | + | for xx=1:1:xmax/dx</br> | |
| - | + | %Predetermine diffusion</br> | |
| - | + | %dIex=DIF(xx,tt) + kIin*Iin(xx,tt) - kIex*Iex(xx,tt);</br> | |
| - | + | dIin=kIin*Iex(xx,tt) -kIex*Iin(xx,tt) +kIir*Ii(xx,tt) -kIif*Iin(xx,tt)*i(xx,tt);</br> | |
| - | + | dIi=kIif*Iin(xx,tt)*i(xx,tt) -kIir*Ii(xx,tt);</br> | |
| - | + | di=kIir*Ii(xx,tt) -kIif*Iin(xx,tt)*i(xx,tt) +kDbr*Db(xx,tt) -kDbf*i(xx,tt)*Dunb(xx,tt);</br> | |
| - | + | dDb=kDbf*i(xx,tt)*Dunb(xx,tt) -kDbr*Db(xx,tt);</br> | |
| - | + | dDunb=kDbr*Db(xx,tt) -kDbf*i(xx,tt)*Dunb(xx,tt);</br> | |
| - | + | dRe=ktscribe*Dunb(xx,tt) -kRdeg*Re(xx,tt);</br> | |
| - | + | dE=ktslate*Re(xx,tt) -kEdeg*E(xx,tt) +kCr*CC(xx,tt) +kP*CC(xx,tt) -kCf*E(xx,tt)*Si(xx,tt);</br> | |
| - | + | dSi=ksin*So -kCf*E(xx,tt)*Si(xx,tt) +kCr*CC(xx,tt);</br> | |
| - | end | + | dCC=kCf*E(xx,tt)*Si(xx,tt) -kCr*CC(xx,tt) - kP*CC(xx,tt);</br> |
| - | + | dP=kP*CC(xx,tt) -kPdeg*P(xx,tt);</br> | |
| - | + | </br> | |
| + | %Iex(xx,tt+1)=Iex(xx,tt)+dIex*dt;</br> | ||
| + | Iin(xx,tt+1)=Iin(xx,tt)+dIin*dt;</br> | ||
| + | Ii(xx,tt+1)=Ii(xx,tt)+dIi*dt;</br> | ||
| + | i(xx,tt+1)=i(xx,tt)+di*dt;</br> | ||
| + | Db(xx,tt+1)=Db(xx,tt)+dDb*dt;</br> | ||
| + | Dunb(xx,tt+1)=Dunb(xx,tt)+dDunb*dt;</br> | ||
| + | Re(xx,tt+1)=Re(xx,tt)+dRe*dt;</br> | ||
| + | E(xx,tt+1)=E(xx,tt)+dE*dt;</br> | ||
| + | Si(xx,tt+1)=Si(xx,tt)+dSi*dt;</br> | ||
| + | CC(xx,tt+1)=CC(xx,tt)+dCC*dt;</br> | ||
| + | P(xx,tt+1)=P(xx,tt)+dP*dt;</br> | ||
| + | </br> | ||
| + | end</br> | ||
| + | tt*dt/tmax*100</br> | ||
| + | end</br> | ||
| + | </br> | ||
| + | </html> | ||
|} | |} | ||
Latest revision as of 02:58, 28 October 2010
| Home | Brainstorm | Team | Acknowledgements | Project | Human Practices | Parts | Notebook | Calendar | Protocol | Safety | Links | References | Media | Contact |
|---|
 "
"


