Team:UNIPV-Pavia/Parts/Characterization/NewParts
From 2010.igem.org
(→BBa_K300093, BBa_K300094, BBa_K300097BBa_K300095 and BBa_K300084 - Phasin and Intein-based TAGs for protein purification) |
(→New Parts: list) |
||
| (30 intermediate revisions not shown) | |||
| Line 27: | Line 27: | ||
</th> | </th> | ||
</tr> | </tr> | ||
| - | </table> | + | </table><br> |
| + | |||
| + | =New Parts: list= | ||
| + | |||
| + | * [[Team:UNIPV-Pavia/Parts/Characterization/NewParts#BBa_K300000 - BioBrick integrative base vector for E. coli |BBa_K300000 - BioBrick integrative base vector for E. coli]] | ||
| + | * [[Team:UNIPV-Pavia/Parts/Characterization/NewParts#BBa_K300001 - BioBrick integrative base vector for S. cerevisiae|BBa_K300001 - BioBrick integrative base vector for S. cerevisiae]] | ||
| + | * [[Team:UNIPV-Pavia/Parts/Characterization/NewParts#BBa_K300010 - PoPS-based self-inducible device|BBa_K300010 - PoPS-based self-inducible device]] | ||
| + | * [[Team:UNIPV-Pavia/Parts/Characterization/NewParts#BBa_K300093, BBa_K300094, BBa_K300097, BBa_K300095, BBa_K300086 and BBa_K300084 - Phasin and Intein-based tags for protein purification|BBa_K300093, BBa_K300094, BBa_K300097, BBa_K300095, BBa_K300086 and BBa_K300084 - Phasin and Intein-based tags for protein purification]] | ||
| + | |||
| + | <br> | ||
| + | ---- | ||
| + | <br> | ||
<tr><td> | <tr><td> | ||
| Line 175: | Line 186: | ||
{|align=center | {|align=center | ||
| - | |[[Image:pv_phenotypeRFPbefore.png|thumb|450px|center|Figure 5: relative | + | |[[Image:pv_phenotypeRFPbefore.png|thumb|450px|center|Figure 5: relative RFP synthesis rate for all the RFP expressing clones. Note: as a reference, typical values of the relative RFP synthesis rate measured for PconRFP in a low copy vector (~5 plasmids per cell) are about 6-7 fold higher (data not shown).]] |
|} | |} | ||
| Line 319: | Line 330: | ||
The correct phenotype of the S288C bearing these parts has still to be validated (by mOrange fluorescence measurement for the <partinfo>BBa_K300007</partinfo> part), as well as the actual integration position (by PCR). | The correct phenotype of the S288C bearing these parts has still to be validated (by mOrange fluorescence measurement for the <partinfo>BBa_K300007</partinfo> part), as well as the actual integration position (by PCR). | ||
| - | |||
=<partinfo>BBa_K300010</partinfo> - PoPS-based self-inducible device= | =<partinfo>BBa_K300010</partinfo> - PoPS-based self-inducible device= | ||
| - | =<partinfo> | + | This is a PoPS-in/PoPS-out device. |
| + | |||
| + | The luxR gene (<partinfo>BBa_C0062</partinfo>) is constitutively produced by the <partinfo>BBa_R0040</partinfo> promoter and it can activate the ''lux pR'' in presence of the autoinducer 3-oxo-C6-homoserine-lactone (3OC6HSL or simply HSL). The PoPS input regulates the production of luxI gene (<partinfo>BBa_C0061</partinfo>). It encodes for the LuxI enzyme, which is able to produce HSL. The produced HSL can diffuse in the growth media of the cells that express LuxI. The ''lux pR'' produces a PoPS output when HSL reaches a critical concentration. | ||
| + | |||
| + | This device can be specialized by assembling a promoter upstream and a promoterless expression system with the gene of interest downstream. When a cell population expresses LuxI, the concentration of HSL is an increasing function of cell culture density and so the induction of the ''lux pR'' promoter occurs only when the cells reach a threshold density. | ||
| + | |||
| + | In this way, the upstream promoter autoinduces the production of the target protein at a critical culture density, depending on the HSL synthesis rate. The HSL synthesis rate can be tuned by assembling promoters of different strengths upstream of ''luxI''. | ||
| + | |||
| + | This enables the construction of a library of self-inducible devices capable of starting the target protein production at a predictable culture density. | ||
| + | |||
| + | This device has been characterized in many different experimental conditions: | ||
| + | * varying the strength of the promoter controlling the production of the signal molecule (Sender Modulation); | ||
| + | * varying the copy number of vectors containing Sender and Receiver circuits; | ||
| + | * varying the growth medium (LB or M9). | ||
| + | |||
| + | The results obtained are reported in the sections below. | ||
| + | |||
| + | Notation: | ||
| + | *Sender: Pcon-RBS-luxI-TT | ||
| + | *Receiver: pTetR-RBS-luxR-TT- lux pR | ||
| + | |||
| + | <partinfo>BBa_K300010</partinfo> was assembled downstream of the constitutive promoters reported in the table, thus obtaining the following parts: | ||
| + | |||
| + | {| border='1' align='center' | ||
| + | | '''BioBrick''' ||'''Description''' | ||
| + | |- | ||
| + | | <partinfo>BBa_K300017</partinfo>|| [[Image:pv_SignalGeneratorSensorDevice.png|300px]]<br>J23118 | ||
| + | |- | ||
| + | | <partinfo>BBa_K300014</partinfo>|| [[Image:pv_SignalGeneratorSensorDevice.png|300px]]<br>J23110 | ||
| + | |- | ||
| + | | <partinfo>BBa_K300015</partinfo>|| [[Image:pv_SignalGeneratorSensorDevice.png|300px]]<br>J23114 | ||
| + | |- | ||
| + | | <partinfo>BBa_K300016</partinfo>|| [[Image:pv_SignalGeneratorSensorDevice.png|300px]]<br>J23116 | ||
| + | |- | ||
| + | | <partinfo>BBa_K300012</partinfo>|| [[Image:pv_SignalGeneratorSensorDevice.png|300px]]<br>J23105 | ||
| + | |} | ||
| + | |||
| + | <partinfo>BBa_J23101</partinfo> and <partinfo>BBa_J23106</partinfo> could not be cloned upstream of these devices because they produced amounts of LuxI protein that give a high metabolic burden for ''E. coli'', so it was not possible to study all the combinations as transformants could not be obtained in some cases. | ||
| + | For each part, a measurement system was built, exploiting the production of the reporter gene GFP (Green Fluorescent Protein) to evaluate the "switch on" condition of every self-inducible promoter. Many different combinations were explored, in order to provide a library of promoters able to initiate transcription at the desired culture density. | ||
| + | |||
| + | ===<b>Modulation of plasmid copy number</b>=== | ||
| + | |||
| + | Sender and receiver devices were assembled in an unique part (such as <partinfo>BBa_K300017</partinfo>, <partinfo>BBa_K300014</partinfo>, <partinfo>BBa_K300015</partinfo>, <partinfo>BBa_K300016</partinfo> and <partinfo>BBa_K300012</partinfo>) in high copy number plasmid <partinfo>pSB1A2</partinfo> or low copy number plasmid <partinfo>pSb4C5</partinfo>. | ||
| + | ===<b>Results</b>=== | ||
| + | |||
| + | The following measurement systems were realized assembling GFP downstream of each self-inducible device. The parts characterized are reported in this table: | ||
| + | |||
| + | {| border='1' align='center' width='80%' | ||
| + | | '''Sender device''' | ||
| + | | '''Sensor systems with GFP''' | ||
| + | |'''Measurement Device''' | ||
| + | |- | ||
| + | |<partinfo>BBa_K300030</partinfo> in <partinfo>pSB1A2</partinfo><br>[[Image:pv_SignalGeneratorDevice.png|150px]]<br>J23118 | ||
| + | |<partinfo>BBa_T9002</partinfo> in <partinfo>pSB1A2</partinfo><br>[[Image:pv_T9002.png|300px]] | ||
| + | |<partinfo>BBa_K300024</partinfo><br>in <partinfo>pSB1A2</partinfo> | ||
| + | |- | ||
| + | |<partinfo>BBa_K300028</partinfo> in <partinfo>pSB1A2</partinfo><br>[[Image:pv_SignalGeneratorDevice.png|150px]]<br>J23110 | ||
| + | |<partinfo>BBa_T9002</partinfo> in <partinfo>pSB1A2</partinfo><br>[[Image:pv_T9002.png|300px]] | ||
| + | |<partinfo>BBa_K300021</partinfo><br>in <partinfo>pSB1A2</partinfo> | ||
| + | |- | ||
| + | |<partinfo>BBa_K300029</partinfo> in <partinfo>pSB1A2</partinfo><br>[[Image:pv_SignalGeneratorDevice.png|150px]]<br>J23116 | ||
| + | |<partinfo>BBa_T9002</partinfo> in <partinfo>pSB1A2</partinfo><br>[[Image:pv_T9002.png|300px]] | ||
| + | |<partinfo>BBa_K300022</partinfo><br>in <partinfo>pSB1A2</partinfo> | ||
| + | |- | ||
| + | |<partinfo>BBa_K300026</partinfo> in <partinfo>pSB1A2</partinfo><br>[[Image:pv_SignalGeneratorDevice.png|150px]]<br>J23105 | ||
| + | |<partinfo>BBa_T9002</partinfo> in <partinfo>pSB1A2</partinfo><br>[[Image:pv_T9002.png|300px]] | ||
| + | |<partinfo>BBa_K300019</partinfo><br>in <partinfo>pSB1A2</partinfo> | ||
| + | |- | ||
| + | |xxx<br>[[Image:pv_SignalGeneratorDevice.png|150px]]<br>J23114 | ||
| + | |<partinfo>BBa_T9002</partinfo> in <partinfo>pSB1A2</partinfo><br>[[Image:pv_T9002.png|300px]] | ||
| + | |<partinfo>BBa_K300023</partinfo><br>in <partinfo>pSB1A2</partinfo> | ||
| + | |- | ||
| + | |<partinfo>BBa_K300030</partinfo> in <partinfo>pSB4C5</partinfo><br>[[Image:pv_SignalGeneratorDevice.png|150px]]<br>J23118 | ||
| + | |<partinfo>BBa_T9002</partinfo> in <partinfo>pSB4C5</partinfo><br>[[Image:pv_T9002.png|300px]] | ||
| + | |<partinfo>BBa_K300024</partinfo><br>in <partinfo>pSB4C5</partinfo> | ||
| + | |- | ||
| + | |<partinfo>BBa_K300028</partinfo> in <partinfo>pSB4C5</partinfo><br>[[Image:pv_SignalGeneratorDevice.png|150px]]<br>J23110 | ||
| + | |<partinfo>BBa_T9002</partinfo> in <partinfo>pSB4C5</partinfo><br>[[Image:pv_T9002.png|300px]] | ||
| + | |<partinfo>BBa_K300021</partinfo><br>in <partinfo>pSB4C5</partinfo> | ||
| + | |- | ||
| + | |<partinfo>BBa_K300029</partinfo> in <partinfo>pSB4C5</partinfo><br>[[Image:pv_SignalGeneratorDevice.png|150px]]<br>J23116 | ||
| + | |<partinfo>BBa_T9002</partinfo> in <partinfo>pSB4C5</partinfo><br>[[Image:pv_T9002.png|300px]] | ||
| + | |<partinfo>BBa_K300022</partinfo><br>in <partinfo>pSB4C5</partinfo> | ||
| + | |- | ||
| + | |<partinfo>BBa_K300026</partinfo> in <partinfo>pSB4C5</partinfo><br>[[Image:pv_SignalGeneratorDevice.png|150px]]<br>J23105 | ||
| + | |<partinfo>BBa_T9002</partinfo> in <partinfo>pSB4C5</partinfo><br>[[Image:pv_T9002.png|300px]] | ||
| + | |<partinfo>BBa_K300019</partinfo><br>in <partinfo>pSB4C5</partinfo> | ||
| + | |} | ||
| + | |||
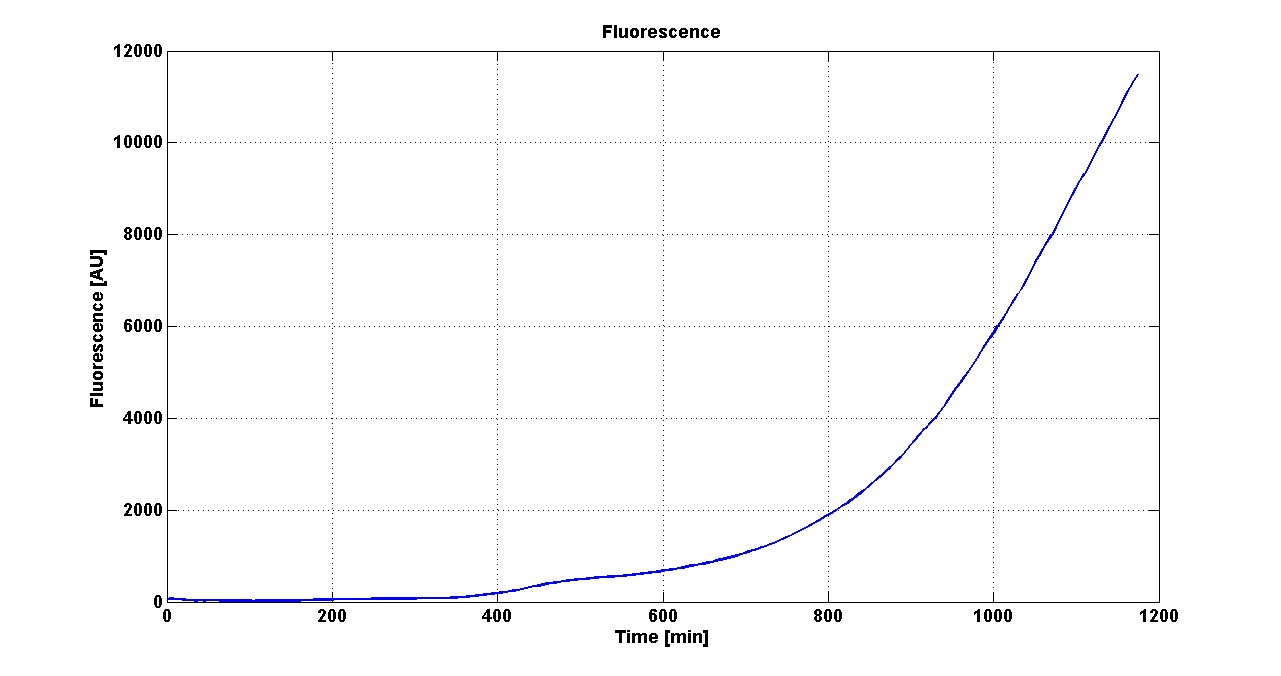
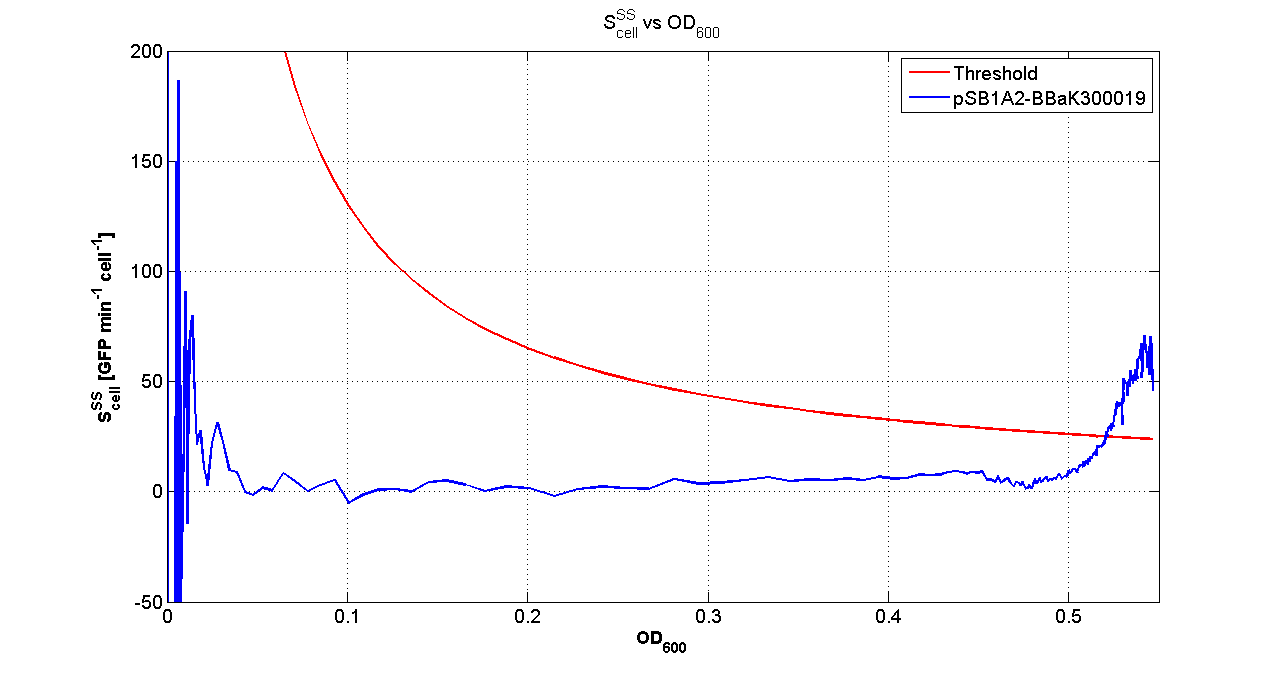
| + | Cultures of ''E. coli'' TOP10 bearing the plasmids containing the self-inducible devices expressing GFP were grown according to [[Team:UNIPV-Pavia/Parts/Characterization#Microplate reader experiments for self-inducible promoters - Protocol #1|this protocol]] and all data collected were analyzed as explained in [[Team:UNIPV-Pavia/Parts/Characterization#Data analysis for self-inducible promoters (initiation-treshold determination)|this section]]. An example of O.D.600 and fluorescence signals for a self-inducible device expressing GFP (<partinfo>BBa_K300026</partinfo>), as well as its Scell signal and the estimated threshold value, is reported below. | ||
| + | |||
| + | {| | ||
| + | |[[Image:pv_GrowthCurveSelf.png|300px|thumb|center|Growth curve of <partinfo>BBa_K300019</partinfo> (O.D.600)]] | ||
| + | |[[Image:pv_FluoCurveSelf.png|300px|thumb|center|Fluorescence curve of <partinfo>BBa_K300019</partinfo> (G.F.P.)]] | ||
| + | |- | ||
| + | |[[Image:pv_FLUvsASB.png|300px|thumb|center|Fluorescence VS Optical density curve of <partinfo>BBa_K300019</partinfo>]] | ||
| + | |[[Image:pv_Scell_Threshold.png|300px|thumb|center|Scell=(dGFP/dt)/O.D.600 and threshold]] | ||
| + | |} | ||
| + | |||
| + | For other examples for the threshold evaluation, you can see: | ||
| + | *<partinfo>BBa_K300012</partinfo> | ||
| + | *<partinfo>BBa_K300016</partinfo> | ||
| + | *<partinfo>BBa_K300028</partinfo> | ||
| + | |||
| + | For every self-inducible device, several parameters were evaluated: | ||
| + | *O.D.start is the O.D.600 corresponding to the transcription initiation of the gene of interest; it was evaluated as reported [[Team:UNIPV-Pavia/Parts/Characterization#Data analysis for self-inducible promoters (initiation-treshold determination)|in this section]]; | ||
| + | *K_HSL is the HSL synthesis rate per cell; it was estimated with the algorithm described [[Team:UNIPV-Pavia/Parts/Characterization#Data analysis to estimate the HSL synthesis rate per cell|here]] | ||
| + | *Doubling time is the period of time required for a cell population to double; it was evaluated as described in [[Team:UNIPV-Pavia/Parts/Characterization#Doubling time evaluation|Doubling time evaluation section]] | ||
| + | *Scell_ratio was evaluated as (Scell_max_Phi)/(Scell_max_J101). Phi is the self-inducible device of ineterst, J101 is the reference standard <partinfo>BBa_J23101</partinfo> contained in the same vector of the receiver device. Scell_max_phi was evaluated for times subsequent to the transcription initiation. | ||
| + | |||
| + | Results are summarized in the following tables: | ||
| + | |||
| + | |||
| + | |||
| + | '''Tab. 1 - Sender and Receiver on high copy plasmid <partinfo>pSB1A2</partinfo>''' | ||
| + | |||
| + | {| border='1' width='80%' | ||
| + | |rowspan='2' align='center'|'''Self-inducible device''' <br><font color='#50C878'>working</font><br><font color='red'>not working</font> | ||
| + | |colspan='4' style="background: yellow" align='center' |LB | ||
| + | |colspan='4' style="background: cyan" align="center" |M9 | ||
| + | |- | ||
| + | |align='center'| '''O.D.start''' | ||
| + | |align='center'| '''K_HSL''' <br> [nmol/min] | ||
| + | |align='center'| '''Doubling time''' <br> [min] | ||
| + | |align='center'| '''Scell ratio''' | ||
| + | |align='center'|'''O.D.start''' | ||
| + | |align='center'| '''K_HSL''' <br> [nmol/min] | ||
| + | |align='center'| '''Doubling time''' <br> [min] | ||
| + | |align='center'|'''Scell ratio''' | ||
| + | |- | ||
| + | |<font color='#50C878'><partinfo>BBa_K300017</partinfo> (wiki name: I7) in <partinfo>pSB1A2</partinfo> plasmid</font> | ||
| + | <br>[[Image:pv_BBa_K300017.png|300px]] | ||
| + | | Constitutive | ||
| + | | 3.11 10^-16 <br> ± <br> 2.23 10^-17 | ||
| + | | 31.15 <br> ± <br> 2.52 | ||
| + | | 0.95 <br> ± <br> 0.15 | ||
| + | | 0.027 <br> ± <br> 0.002 | ||
| + | | 1.52 10^-15 <br> ± <br> 9.76 10^-17 | ||
| + | | 61.28 <br> ± <br> 2.67 | ||
| + | | 1.68 <br> ± <br> 0.23 | ||
| + | |- | ||
| + | |<font color='#50C878'><partinfo>BBa_K300014</partinfo> (wiki name: I8) in <partinfo>pSB1A2</partinfo> plasmid</font> | ||
| + | <br>[[Image:pv_BBa_K300014.png|300px]] | ||
| + | | <font color='red' size='+2'>X</font> | ||
| + | | <font color='red' size='+2'>X</font> | ||
| + | | 27.86 <br> ± <br> 1.14 | ||
| + | | <font color='red' size='+2'>X</font> | ||
| + | | 0.13 <br> ± <br> 0.023 ** | ||
| + | | 3.59 10^-16 <br> ± <br> 1.22 10^-16 ** | ||
| + | | 0.37 <br> ± <br> 0.13 ** | ||
| + | | 53.09 <br> ± <br> 1.18 ** | ||
| + | |- | ||
| + | |<font color='#50C878'><partinfo>BBa_K300015</partinfo> (wiki name: I9) in <partinfo>pSB1A2</partinfo> plasmid</font> | ||
| + | <br>[[Image:pv_BBa_K300015.png|300px]] | ||
| + | | 0.33 <br> * | ||
| + | | 8.94 10^-17 <br> * | ||
| + | | 33.81 <br> ± <br> 3.03 | ||
| + | | 0.98 <br> * | ||
| + | | 0.38 <br> ± <br> 0.02 | ||
| + | | 3.78 10^-17 <br> ± <br> 4.65 10^-18 | ||
| + | | 57.20 <br> ± <br> 1.32 | ||
| + | | 0.07 <br> ± <br> 0.01 | ||
| + | |- | ||
| + | |<font color='#50C878'><partinfo>BBa_K300016</partinfo> (wiki name: I10) in <partinfo>pSB1A2</partinfo> plasmid</font> | ||
| + | <br>[[Image:pv_BBa_K300016.png|300px]] | ||
| + | | 0.54 <br> * | ||
| + | | 7.53 10^-18 <br> * | ||
| + | | 39.55 <br> ± <br> 0.32 | ||
| + | | 0.21 <br> * | ||
| + | | 0.32 <br> ± <br> 0.02 | ||
| + | | 5.70 10^-17 <br> ± <br> 7.75 10^-18 | ||
| + | | 55.33 <br> ± <br> 5.19 | ||
| + | | 0.13 <br> ± <br> 0.02 | ||
| + | |- | ||
| + | |<font color='#50C878'><partinfo>BBa_K300012</partinfo> (wiki name: I12) in <partinfo>pSB1A2</partinfo> plasmid</font> | ||
| + | <br>[[Image:pv_BBa_K300012.png|300px]] | ||
| + | | 0.50 <br> ± <br> 0.01 | ||
| + | | 1.16 10^-17 <br> ± <br> 6.41 10^-19 | ||
| + | | 36.66 <br> ± <br> 2.50 | ||
| + | | 0.58 <br> ± <br> 0.02 | ||
| + | | 0.30 <br> ± <br> 0.03 | ||
| + | | 6.53 10^-17 <br> ± <br> 1.43 10^-17 | ||
| + | | 50.92 <br> ± <br> 2.92 | ||
| + | | 0.21 <br> ± <br> 0.06 | ||
| + | |} | ||
| + | |||
| + | |||
| + | |||
| + | '''Tab. 2 - Sender and Receiver on low copy plasmid <partinfo>pSB4C5</partinfo>''' | ||
| + | |||
| + | {| border='1' width='80%' | ||
| + | |rowspan='2' align='center'|'''Self-inducible device''' <br><font color='#50C878'>working</font><br><font color='red'>not working</font> | ||
| + | |colspan='4' style="background: yellow" align='center' |LB | ||
| + | |colspan='4' style="background: cyan" align="center" |M9 | ||
| + | |- | ||
| + | |align='center'| '''O.D.start''' | ||
| + | |align='center'| '''K_HSL''' <br> [nmol/min] | ||
| + | |align='center'| '''Doubling time''' <br>[min] | ||
| + | |align='center'| '''Scell ratio''' | ||
| + | |align='center'|'''O.D.start''' | ||
| + | |align='center'| '''K_HSL'''<br> [nmol/min] | ||
| + | |align='center'| '''Doubling time''' <br>[min] | ||
| + | |align='center'|'''Scell ratio''' | ||
| + | |- | ||
| + | |<font color='#50C878'><partinfo>BBa_K300017</partinfo> (wiki name: I7) in <partinfo>pSB4C5</partinfo> plasmid</font><br>[[Image:pv_BBa_K300017.png|300px]] | ||
| + | | <font color='red' size='+2'>X</font> | ||
| + | | <font color='red' size='+2'>X</font> | ||
| + | | <font color='red' size='+2'>X</font> | ||
| + | | <font color='red' size='+2'>X</font> | ||
| + | | 0.24 <br> ± <br> 0.0004 ** | ||
| + | | not computed | ||
| + | | 62.41 <br> ± <br> 1.56 ** | ||
| + | | not computed | ||
| + | |- | ||
| + | |<font color='red'><partinfo>BBa_K300014</partinfo> (wiki name: I8) in <partinfo>pSB4C5</partinfo> plasmid</font> | ||
| + | <br>[[Image:pv_BBa_K300014.png|300px]] | ||
| + | | <font color='red' size='+2'>X</font> | ||
| + | | <font color='red' size='+2'>X</font> | ||
| + | | <font color='red' size='+2'>X</font> | ||
| + | | <font color='red' size='+2'>X</font> | ||
| + | | <font color='red' size='+2'>X</font> | ||
| + | | <font color='red' size='+2'>X</font> | ||
| + | | <font color='red' size='+2'>X</font> | ||
| + | | <font color='red' size='+2'>X</font> | ||
| + | |- | ||
| + | |<font color='red'><partinfo>BBa_K300015</partinfo> (wiki name: I9) in <partinfo>pSB4C5</partinfo> plasmid</font> | ||
| + | <br>[[Image:pv_BBa_K300015.png|300px]] | ||
| + | | <font color='red' size='+2'>X</font> | ||
| + | | <font color='red' size='+2'>X</font> | ||
| + | | <font color='red' size='+2'>X</font> | ||
| + | | <font color='red' size='+2'>X</font> | ||
| + | | <font color='red' size='+2'>X</font> | ||
| + | | <font color='red' size='+2'>X</font> | ||
| + | | <font color='red' size='+2'>X</font> | ||
| + | | <font color='red' size='+2'>X</font> | ||
| + | |- | ||
| + | |<font color='red'><partinfo>BBa_K300016</partinfo> (wiki name: I10) in <partinfo>pSB4C5</partinfo> plasmid</font> | ||
| + | <br>[[Image:pv_BBa_K300016.png|300px]] | ||
| + | | <font color='red' size='+2'>X</font> | ||
| + | | <font color='red' size='+2'>X</font> | ||
| + | | <font color='red' size='+2'>X</font> | ||
| + | | <font color='red' size='+2'>X</font> | ||
| + | | <font color='red' size='+2'>X</font> | ||
| + | | <font color='red' size='+2'>X</font> | ||
| + | | <font color='red' size='+2'>X</font> | ||
| + | | <font color='red' size='+2'>X</font> | ||
| + | |- | ||
| + | |<font color='red'><partinfo>BBa_K300012</partinfo> (wiki name: I12) in <partinfo>pSB4C5</partinfo> plasmid</font> | ||
| + | <br>[[Image:pv_BBa_K300012.png|300px]] | ||
| + | | <font color='red' size='+2'>X</font> | ||
| + | | <font color='red' size='+2'>X</font> | ||
| + | | <font color='red' size='+2'>X</font> | ||
| + | | <font color='red' size='+2'>X</font> | ||
| + | | <font color='red' size='+2'>X</font> | ||
| + | | <font color='red' size='+2'>X</font> | ||
| + | | <font color='red' size='+2'>X</font> | ||
| + | | <font color='red' size='+2'>X</font> | ||
| + | |} | ||
| + | |||
| + | |||
| + | <div id="box" style="width: 70%; margin-left: 137px; padding: 5px; border: 1px solid #000; background-color: #f6f6f6;"> | ||
| + | <div id="template" style="text-align: center; font-weight: bold; font-size: large; color: black; padding: 5px;"> | ||
| + | LEGEND OF TABLES: | ||
| + | </div> | ||
| + | <div id="legend" style="font-weight: normal; font-size: small; color: black; padding: 5px;"> | ||
| + | ''Constitutive'': the induction point, in term of O.D.600, is under the minimum detectable value calculated by the algorithm. This minimum value was estimated by running the algorithm on data acquired from a culture that constitutively produces GFP. For this reason, the devices labelled as ''constitutive'' can be considered as constitutive GFP producers. | ||
| + | |||
| + | <nowiki>*</nowiki>: in two of three experiments the self-induction failed, thus having a non-induced culture for all the cell densities. The standard errors were not computed for these cultures. | ||
| + | |||
| + | <nowiki>**</nowiki>: in one of three experiments the self-induction failed, thus having a non-induced culture for all the cell densities. The standard errors were computed on two independent experiments. | ||
| + | |||
| + | <partinfo>BBa_K300016</partinfo> is labelled with <nowiki>*</nowiki>, but probably induction failed in two of the three experiments because the culture didn't reach the O.D.start point (the experiment was stopped before the culture reached the O.D.600 critical value). | ||
| + | </div> | ||
| + | </div> | ||
| + | |||
| + | '''Discussion''': a modular PoPS-based devices (<partinfo>BBa_K300010</partinfo> was designed and used to realize a library of self-inducible devices, able to start the production of the heterologous protein at a defined culture density. Other members of this promoters' family are derived from <partinfo>BBa_K300009</partinfo> (see the proper section for details). | ||
| + | |||
| + | They were characterized in many different experimental conditions: | ||
| + | *varying the strength of the promoter controlling the production of the signal molecule (Sender Modulation) | ||
| + | *varying the copy number of vectors bearing both Sender and Receiver circuits | ||
| + | *varying the growth medium (LB or M9) | ||
| + | |||
| + | A graphical summary is reported in the figures below: | ||
| + | {| | ||
| + | |[[Image:pv_SwitchPointLB.png|700px|thumb|center| Typical ''E. coli'' growth curve with O.D.start evaluated by Threshold algorithm in LB]] | ||
| + | |- | ||
| + | |[[Image:pv_SwitchPointM9.png|700px|thumb|center| Typical ''E. coli'' growth curve with O.D.start evaluated by Threshold algorithm in M9]] | ||
| + | |} | ||
| + | |||
| + | A model-based approach was proposed to estimate many interesting parameters, such as the HSL synthesis rate per cell, and an algorithm was proposed in order to evaluate the O.D.start for every self-inducible device. | ||
| + | |||
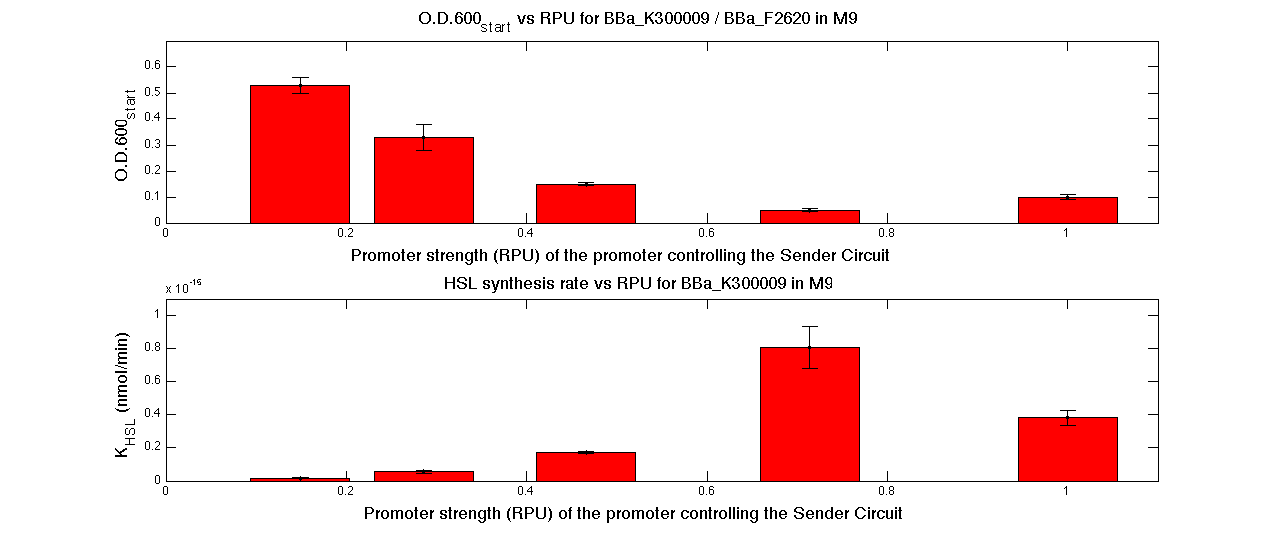
| + | In the figures below, the O.D.start and the HSL synthesis rate as a function of the strength of the promoter (RPU) controlling the signal molecule production are reported for <partinfo>BBa_K300010</partinfo> (Sender&Receiver device in HC plasmid) and for <partinfo>BBa_K300009</partinfo>/<partinfo>BBa_F2620</partinfo> (Sender device in LC plasmid in combination with Receiver device in HC plasmid). | ||
| + | |||
| + | {| | ||
| + | |[[Image:pv_RPUvsOD_HCHC_M9.png|700px|thumb|center| O.D.start and K_HSL as a function of RPUs of the promoters controlling the signal molecule production for <partinfo>BBa_K300010</partinfo> in high copy number plasmid in M9 medium]] | ||
| + | |- | ||
| + | |[[Image:pv_RPUvsOD_HCLC_M9.png|700px|thumb|center| O.D.start and K_HSL as a function of RPUs of the promoters controlling the autoinducer production for <partinfo>BBa_K300010</partinfo> in low copy number plasmid used in combination with <partinfo>BBa_F2620</partinfo> in high copy plasmid in M9 medium]] | ||
| + | |} | ||
| + | |||
| + | A strong correlation between the promoter strength, previously measured in RPU, and the O.D.start is depicted by the reported graphs. This is consistent with the expected behaviour of these parts, since the HSL synthesis rate is an increasing function of the upstream promoter's strength. | ||
| + | |||
| + | For RPU values greater or equal to 1, the expected behaviour is not confirmed anymore. This is probably because too high luxI expression levels and/or synthesis rate of HSL are injurious for the cell. | ||
| + | |||
| + | The combination of promoter strength variation and plasmid copy number modulation allows the creation of a library of self-inducible devices able to perform autoinduction at many different O.D.600 values, in any cellular growth phase. | ||
| + | |||
| + | =<partinfo>BBa_K300093</partinfo>, <partinfo>BBa_K300094</partinfo>, <partinfo>BBa_K300097</partinfo>, <partinfo>BBa_K300095</partinfo>, <partinfo>BBa_K300086</partinfo> and <partinfo>BBa_K300084</partinfo> - Phasin and Intein-based tags for protein purification= | ||
These parts are built by assembling Phasins (<partinfo>BBa_K300002</partinfo> and <partinfo>BBa_K300003</partinfo>) that are able to bind to PolyHydroxyAlkanoates (PHA) | These parts are built by assembling Phasins (<partinfo>BBa_K300002</partinfo> and <partinfo>BBa_K300003</partinfo>) that are able to bind to PolyHydroxyAlkanoates (PHA) | ||
| Line 330: | Line 645: | ||
These parts has been characterized respectively through: | These parts has been characterized respectively through: | ||
*pTet costitutive promoter devices: | *pTet costitutive promoter devices: | ||
| + | **<partinfo>BBa_K300086</partinfo> | ||
**<partinfo>BBa_K300088</partinfo> | **<partinfo>BBa_K300088</partinfo> | ||
**<partinfo>BBa_K300090</partinfo> | **<partinfo>BBa_K300090</partinfo> | ||
| Line 339: | Line 655: | ||
==pTet costitutive promoter devices== | ==pTet costitutive promoter devices== | ||
| + | ====Methods==== | ||
| + | Inoculum (into 5 ml LB+Amp) from glycerol stock of: | ||
| + | *<partinfo>BBa_K300086</partinfo> | ||
| + | *<partinfo>BBa_K300088</partinfo> | ||
| + | *<partinfo>BBa_K300090</partinfo> | ||
| + | *<partinfo>BBa_K300099</partinfo> | ||
| + | *<partinfo>BBa_K173000</partinfo> (positive control, J23100 constitutive promoter expressing GFP) | ||
| + | *<partinfo>BBa_B0031</partinfo> (negative control, a non-fluorescent culture) | ||
| + | Cultures were grown ON at 37°C, 220 rpm. | ||
| + | |||
| + | The following day cultures were diluted 1:100 and let grow again for about five hours at 37°C, 220 rpm. | ||
| + | |||
| + | The optical density (O.D.) of each culture was than measured with TECAN Infinte F200. Samples were diluted in order to obtain the same O.D. equal to 0.02. | ||
| + | |||
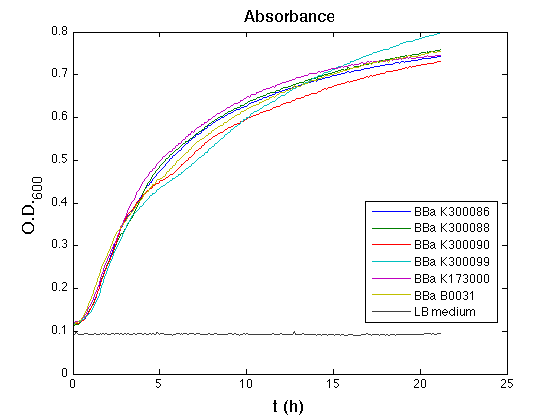
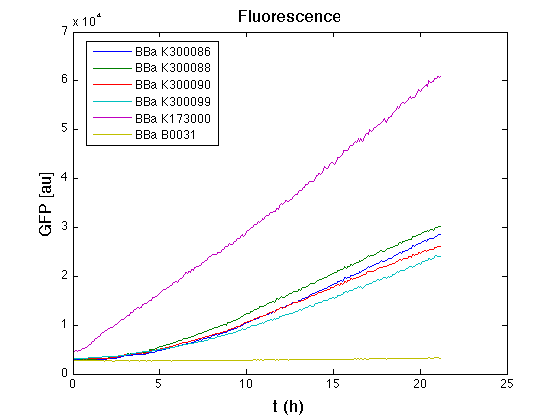
| + | Then we performed a 21-hour experiment with measurements of absorbance and green fluorescence every five minutes with TECAN Infinite F200; cultures were shaken for 15 seconds every five minutes. Acquired data were blanked by subtracting the media absorbance (for absorbance measurements) and the <partinfo>BBa_B0031</partinfo> fluorescence (for fluorescence measurements). Then, the relative GFP synthesis rate per cell was evaluated by computing (1/O.D.600)*dGFP/dt, where O.D.600 is the blanked absorbance of the culture of interest and GFP is its blanked fluorescence. | ||
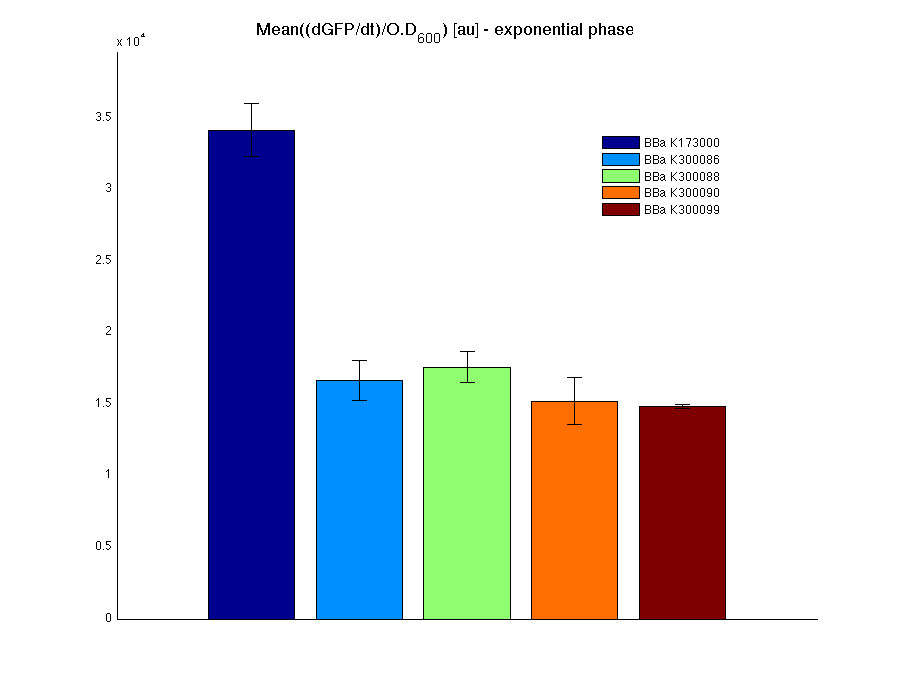
| + | Each value shown below is the mean of three measurements in exponential phase and error bars represent the 95% confidence interval of the mean. | ||
| + | |||
| + | ====Results==== | ||
| + | <div align="center"> | ||
| + | <table border="0"> | ||
| + | <tr> | ||
| + | <td>[[Image:UNIPV10_pTET_c_ASB.png|thumb|300px|Raw growth curve]]</td> | ||
| + | <td>[[Image:UNIPV10_pTET_c_GFP.png|thumb|300px|Raw GFP curve]]</td> | ||
| + | </tr> | ||
| + | </table> | ||
| + | <table> | ||
| + | <tr> | ||
| + | <td>[[Image:UNIPV10_pTET_c_BAR.png|thumb|300px|Mean (dGFP/dt)/O.D. over the exponential phase (under the hypothesis that GFP half-life in fusion contructs is similar to the original one -<partinfo>BBa_E0040</partinfo>)]]</td> | ||
| + | </tr> | ||
| + | </table> | ||
| + | |||
| + | <table border="1"> | ||
| + | <tr align="center"> | ||
| + | <th>Culture</th><th>Doubling time [min.] ± std error</th> | ||
| + | </tr> | ||
| + | <tr align="center"> | ||
| + | <td><partinfo>BBa_K173000</partinfo></td><td>76.3336 ± 1.4362</td> | ||
| + | </tr> | ||
| + | <tr align="center"> | ||
| + | <td><partinfo>BBa_K300086</partinfo></td><td>73.6685 ± 1.6245</td> | ||
| + | </tr> | ||
| + | <tr align="center"> | ||
| + | <td><partinfo>BBa_K300088</partinfo></td><td>74.8806 ± 2.7699</td> | ||
| + | </tr> | ||
| + | <tr align="center"> | ||
| + | <td><partinfo>BBa_K300090</partinfo></td><td>75.9433 ± 3.6808</td> | ||
| + | </tr> | ||
| + | <tr align="center"> | ||
| + | <td><partinfo>BBa_K300099</partinfo></td><td>78.4634 ± 2.5622</td> | ||
| + | </tr> | ||
| + | <tr align="center"> | ||
| + | <td><partinfo>BBa_B0031</partinfo></td><td>70.8421 ± 2.2181</td> | ||
| + | </tr> | ||
| + | </table> | ||
| + | </div> | ||
| + | |||
| + | ====Discussion==== | ||
| + | All the cultures showed a similar growth curve; doubling time was computed as described [https://2010.igem.org/Team:UNIPV-Pavia/Parts/Characterization#Doubling_time_evaluation here] in order to obtain information about the metabolic burden due to the synthesis of the studied fusion proteins. It is possible to see that all doubling times are comparable; it is possible to assert that the expression of these BioBrick parts doesn't cause abnormal stress to the cells. | ||
| + | |||
| + | From GFP curve it is possible to appreciate that in <partinfo>BBa_K300086</partinfo>, <partinfo>BBa_K300088</partinfo>, <partinfo>BBa_K300090</partinfo>, <partinfo>BBa_K300099</partinfo> GFP accumulation is very similar and it is significantly different from the one of the negative control <partinfo>BBa_B0031</partinfo>. These results show that the green fluorescent protein assembled downstream of the genetic circuit is correctly folded. | ||
| + | |||
| + | The mean protein synthesis rate was also computed over the exponential growth phase, showing again an appreciable GFP production rate that is about half of the positive control GFP. | ||
==3OC6HSL inducible devices== | ==3OC6HSL inducible devices== | ||
| + | ====Methods==== | ||
| + | Inoculum (into 5 ml LB+Amp) from glycerol stock of: | ||
| + | *<partinfo>BBa_K300091</partinfo> | ||
| + | *<partinfo>BBa_K300092</partinfo> | ||
| + | *<partinfo>BBa_K173000</partinfo> (positive control) | ||
| + | *<partinfo>BBa_B0031</partinfo> (negative control) | ||
| + | Cultures were grown ON at 37°C, 220 rpm. | ||
| + | |||
| + | The following day cultures were diluted 1:100 and let grow again for about five hours at 37°C, 220 rpm. | ||
| + | |||
| + | The optical density (O.D.) of each culture was than measured with TECAN Infinte F200. Samples were diluted in order to obtain the same O.D. equal to 0.02. | ||
| + | |||
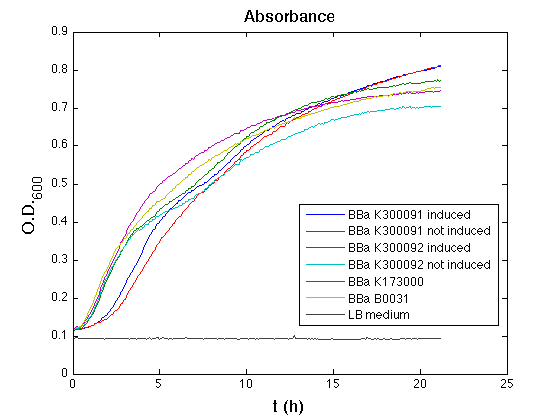
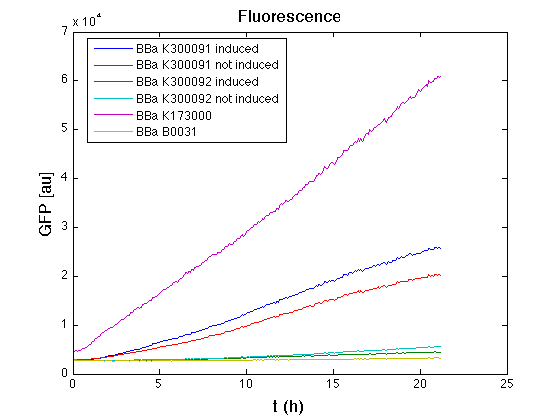
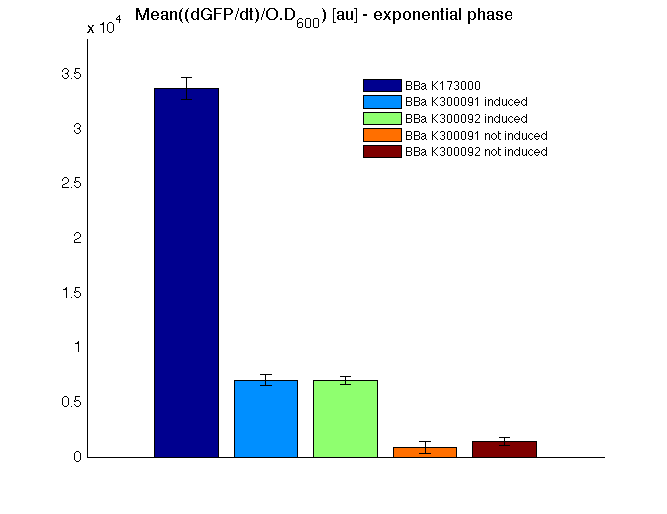
| + | Then we performed a 21-hour experiment with measurements of absorbance and green fluorescence every five minutes using TECAN Infinite F200; cultures were shaken for 15 seconds every five minutes. <partinfo>BBa_K300091</partinfo> and <partinfo>BBa_K300092</partinfo> constructs were induced with 100nM of HSL directly in the 96-well microplate. Acquired data were blanked by subtracting the media absorbance (for absorbance measurements) and the <partinfo>BBa_B0031</partinfo> fluorescence (for fluorescence measurements). Then, the relative GFP synthesis rate per cell was evaluated by computing (1/O.D.600)*dGFP/dt, where O.D.600 is the blanked absorbance of the culture of interest and GFP is its blanked fluorescence. | ||
| + | Each value shown below is the mean of three measurements in exponential phase and error bars represent the 95% confidence interval of the mean. | ||
| + | |||
| + | ====Results==== | ||
| + | <div align="center"> | ||
| + | <table> | ||
| + | <tr> | ||
| + | <td>[[Image:UNIPV10_HSL_c_ASB.png|thumb|300px|Raw growth curve]]</td> | ||
| + | <td>[[Image:UNIPV10_HSL_c_GFP.png|thumb|300px|Raw GFP curve]]</td> | ||
| + | </tr> | ||
| + | </table> | ||
| + | <table> | ||
| + | <tr> | ||
| + | <td>[[Image:UNIPV10_HSL_c_BAR.png|thumb|300px|Mean (dGFP/dt)/O.D. over the exponential phase (under the hypothesis that GFP half-life in fusion contructs is similar to the original one -<partinfo>BBa_E0040</partinfo>)]]</td> | ||
| + | </tr> | ||
| + | </table> | ||
| + | |||
| + | <table border="1"> | ||
| + | <tr align="center"> | ||
| + | <th>Culture</th><th>Doubling time [min.] ± std error</th> | ||
| + | </tr> | ||
| + | <tr align="center"> | ||
| + | <td><partinfo>BBa_K173000</partinfo></td><td>76.3336 ± 1.4362</td> | ||
| + | </tr> | ||
| + | <tr align="center"> | ||
| + | <td><partinfo>BBa_K300091</partinfo><br/>induced</td><td>121.1434 ± 7.0275</td> | ||
| + | </tr> | ||
| + | <tr align="center"> | ||
| + | <td><partinfo>BBa_K300091</partinfo><br/>not induced</td><td>74.4267 ± 1.3696</td> | ||
| + | </tr> | ||
| + | <tr align="center"> | ||
| + | <td><partinfo>BBa_K300092</partinfo><br/>induced</td><td>122.6088 ± 1.2785</td> | ||
| + | </tr> | ||
| + | <tr align="center"> | ||
| + | <td><partinfo>BBa_K300092</partinfo><br/>not induced</td><td>71.5105 ± 2.7113</td> | ||
| + | </tr> | ||
| + | <tr align="center"> | ||
| + | <td><partinfo>BBa_B0031</partinfo></td><td>70.8421 ± 2.2181</td> | ||
| + | </tr> | ||
| + | </table> | ||
| + | </div> | ||
| + | |||
| + | ====Discussion==== | ||
| + | All the cultures showed a similar growth curve; doubling time was computed as described [https://2010.igem.org/Team:UNIPV-Pavia/Parts/Characterization#Doubling_time_evaluation here] in order to obtain information about the burden due to the synthesis of such fusion proteins. It is possible to see that all doubling times are very similar except for induced cultures. In this case doubling time is much higher than both positive control and non-induced cultures; for this reason it is possible to assert that induction gives a high metabolic burden. | ||
| + | |||
| + | From GFP curve and mean protein synthesis rate it is possible to appreciate that induced <partinfo>BBa_K300091</partinfo> and <partinfo>BBa_K300092</partinfo> GFP accumulation profiles are comparable and they significantly differ from the GFP raw time series of the negative control <partinfo>BBa_B0031</partinfo>. On the other hand not induced <partinfo>BBa_K300091</partinfo> and <partinfo>BBa_K300092</partinfo> show a profile that is very similar to the negative control. These results show that the green fluorescent protein assembled downstream of the construct is correctly folded and that the inducible system works as expected. | ||
| + | Not induced <partinfo>BBa_K300091</partinfo> and <partinfo>BBa_K300092</partinfo> show a low GFP synthesis rate maybe due to 3OC6HSL inducible | ||
</td> | </td> | ||
</tr> | </tr> | ||
Latest revision as of 03:14, 28 October 2010
|
|
||||||||||||||||||||||||||||||||||||||||||||||||||||||||||||||||||||||||||||||||||||||||||||||||||||||||||||||||||||||||||||||||||||||||||||||||||||||||||||||||||||||||||||||||||||||||||||||
|
|
|||||||||||||||||||||||||||||||||||||||||||||||||||||||||||||||||||||||||||||||||||||||||||||||||||||||||||||||||||||||||||||||||||||||||||||||||||||||||||||||||||||||||||||||||||||||||||||
 "
"


