Team:UNIPV-Pavia/Material Methods/Measurements/Tecan/test28settembre
From 2010.igem.org
m (→RESULTS) |
m (→Methods) |
||
| (12 intermediate revisions not shown) | |||
| Line 19: | Line 19: | ||
==EXPERIMENT DESCRIPTION== | ==EXPERIMENT DESCRIPTION== | ||
===Motivation=== | ===Motivation=== | ||
| - | This experiment was performed to check bacterial growth and GFP | + | This experiment was performed to check bacterial growth and GFP synthesis rate of the following constructs in order to verify right protein folding and efficiency of inducible system assembled upstream of some genetic circuits. |
===Methods=== | ===Methods=== | ||
| Line 28: | Line 28: | ||
*<partinfo>BBa_K173000</partinfo> (positive control) | *<partinfo>BBa_K173000</partinfo> (positive control) | ||
*<partinfo>BBa_B0031</partinfo> (negative control) | *<partinfo>BBa_B0031</partinfo> (negative control) | ||
| - | + | Cultures were grown ON at 37°C, 220 rpm. | |
| - | The following day cultures were diluted 1:100 and let grow again for about five hours at | + | The following day cultures were diluted 1:100 and let grow again for about five hours at 37°C, 220 rpm. |
| - | + | The optical density (O.D.) of each cell culture was than measured with TECAN Infinte F200. Samples were diluted in order to obtain the same O.D. equal to 0,02. | |
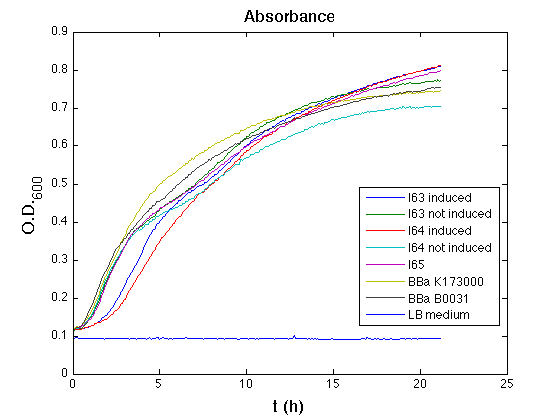
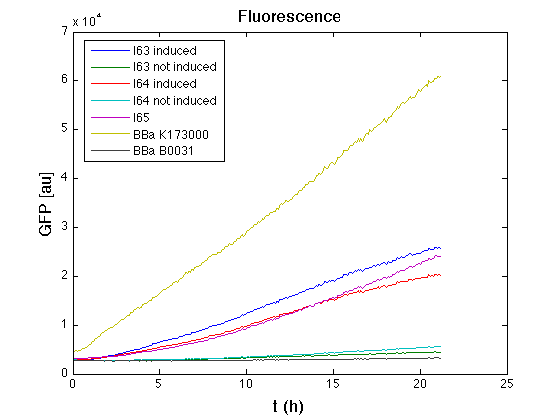
| - | + | Then we performed a 21-hours' experiment with measurements of absorbance and green fluorescence every five minutes with TECAN Infinite F200; cultures were shaken for 15 seconds every five minutes. I63 and I64 circuits were also induced 100nM with HSL directly into multiplate well. Each value shown below is the mean of three measurements, from GFP data that of a non-fluorescent culture (negative control) was subtracted. | |
==RESULTS== | ==RESULTS== | ||
| Line 42: | Line 42: | ||
<table border="1"> | <table border="1"> | ||
<tr align="center"> | <tr align="center"> | ||
| - | <th>Culture</th><th>Doubling time [min.]</th> | + | <th>Culture</th><th>Doubling time [min.] ± std error</th> |
</tr> | </tr> | ||
<tr align="center"> | <tr align="center"> | ||
| - | <td><partinfo>BBa_K173000</partinfo></td><td> | + | <td><partinfo>BBa_K173000</partinfo></td><td>76.3336 ± 1.4362</td> |
</tr> | </tr> | ||
<tr align="center"> | <tr align="center"> | ||
| - | <td>I63<br/>induced</td><td>121</td> | + | <td>I63<br/>induced</td><td>121.1434 ± 7.0275</td> |
</tr> | </tr> | ||
<tr align="center"> | <tr align="center"> | ||
| - | <td>I63<br/> | + | <td>I63<br/> not induced</td><td>74.4267 ± 1.3696</td> |
</tr> | </tr> | ||
<tr align="center"> | <tr align="center"> | ||
| - | <td>I64<br/>induced</td><td> | + | <td>I64<br/>induced</td><td>122.6088 ± 1.2785</td> |
</tr> | </tr> | ||
<tr align="center"> | <tr align="center"> | ||
| - | <td>I64<br/> | + | <td>I64<br/>not induced</td><td>71.5105 ± 2.7113</td> |
</tr> | </tr> | ||
<tr align="center"> | <tr align="center"> | ||
| - | <td>I65</td><td>78</td> | + | <td>I65</td><td>78.4634 ± 2.5622</td> |
</tr> | </tr> | ||
<tr align="center"> | <tr align="center"> | ||
| - | <td><partinfo>BBa_B0031</partinfo></td><td> | + | <td><partinfo>BBa_B0031</partinfo></td><td>70.8421 ± 2.2181</td> |
</tr> | </tr> | ||
</table> | </table> | ||
| Line 69: | Line 69: | ||
[[Image:UNIPV_Pavia_GFP28settembre.png|thumb|500px |center|Raw GFP curve]] | [[Image:UNIPV_Pavia_GFP28settembre.png|thumb|500px |center|Raw GFP curve]] | ||
| - | [[Image:UNIPV10 SScellM28settembre.png|thumb|500px |center|Mean of (dGFP/dt)/O.D.600 (under the hypothesis that half-life | + | [[Image:UNIPV10 SScellM28settembre.png|thumb|500px |center|Mean of (dGFP/dt)/O.D.600 (under the hypothesis that GFP half-life in fusion contructs is similar to the original one - <partinfo>BBa_E0040</partinfo>)]] |
| - | All | + | All cell cultures showed a similar growth curve; doubling time was computed as described [[Team:UNIPV-Pavia/Parts/Characterization#Doubling_time_evaluation|here]] in order to have informations about the burden due to synthesis of such fusion proteins. It's possible to see that all doubling time are very similar except for induced cultures. In this case doubling time is much higher than positive control and not induced cultures; so it's possible to assert that in this case there's a kind of metabolic burden higher than in the others, maybe because of the inducible system. |
| + | |||
| + | From GFP curve it's possible to appreciate that in induced I63, I64 and I65 GFP accumulation profile it's very similar and it's significantly different from that of negative control <partinfo>BBa_B0031</partinfo>. On the other hand not induced I63 and I64 show a profile very similar to the last one. This result that the green fluorescent protein assembled downstream of the genetic circuit is correctly folded. | ||
| + | |||
| + | The mean protein synthesis rate was also computed over the growth exponential phase, showing again an appreciable GFP production rate for I65 and a lower one for inducible constructs. Also not induced I63 and I64 show a low GFP synthesis rate maybe due to 3OC6HSL inducible circuit leakage activity. | ||
<!-- table previous next test --> | <!-- table previous next test --> | ||
Latest revision as of 22:23, 27 October 2010
|
|
||||||||||||||||||||||||||||||||
|
|
|
||||||||||||||||||||||||||||||
 "
"


