Team:Stockholm/18 October 2010
From 2010.igem.org
(→Andreas) |
m |
||
| (8 intermediate revisions not shown) | |||
| Line 72: | Line 72: | ||
*#0.5 μl pEX.hS.RyC | *#0.5 μl pEX.hS.RyC | ||
| - | ===PCR verification for Uppsala team=== | + | ===PCR verification for Uppsala-Sweden team=== |
Helping the Uppsala team with a PCR verification of one of their assemblies. | Helping the Uppsala team with a PCR verification of one of their assemblies. | ||
| Line 85: | Line 85: | ||
PCR run ON. | PCR run ON. | ||
| + | |||
| + | ==Nina== | ||
| + | |||
| + | ===Polyacrylamide gel on SOD=== | ||
| + | |||
| + | I ran a polyacrylamide gel on SOD that I have tried to get pure. | ||
| + | |||
| + | Ladder: PageRuler Unst. Protein Ladder Fermentas | ||
| + | |||
| + | [[Image:Mlös1.jpg|200px]] | ||
| + | |||
| + | Arragement on gel: | ||
| + | |||
| + | [[Image:Aq6.jpg]] | ||
| + | |||
| + | I had a Coomassie blue staning and destaining on the gel. | ||
| + | |||
| + | [[Image:Aq5.jpg|250px]] | ||
| + | |||
| + | ===Protein concentration=== | ||
| + | |||
| + | I measured the protein conc on the samples: unbound, wash 1-3, elute 1-4 and not pure to check if I had any proteins. I had to test this since the gel shows that I don't have any proteins, even not much in the unbound lane, which should have a lot of bands. It could also be that my samples that I loaded onto the gel was very diluted since I had fractions consisting of 10 ml solution. This could give me an indication wheter I need to concentrate my fractions with a Millipore centrifugation. | ||
| + | |||
| + | I measured the concentrations using a BSA-method. | ||
| + | |||
| + | I got a standard curve from another student (Annika) in the lab I work in. | ||
| + | |||
| + | [[Image:Aq7.jpg|400px]] | ||
| + | |||
| + | The standard curve was obtained by following this: | ||
| + | |||
| + | [[Image:Aq8.jpg|400px]] | ||
| + | |||
| + | I measured the conc by following these instructions: | ||
| + | |||
| + | [[Image:Aq9.jpg|400px]] | ||
| + | |||
| + | I got these absorbance values for each well I loaded: | ||
| + | |||
| + | [[Image:Aq11.jpg|750px]] | ||
| + | |||
| + | Samples from top to bottom: unbound, wash 1-3, elute 1-4. | ||
| + | |||
| + | |||
| + | From the standard curve I can calculate the protein concentration: | ||
| + | |||
| + | A = 0.3617 * C + 0.0778 | ||
| + | |||
| + | C = (A-0.0778)/0.3617 | ||
| + | |||
| + | However I realized that the blank I used did not have any imidazole added, this is therefore not a good control for the elute samples since they contain a high amount of imidazole. | ||
| + | |||
| + | The imidazole molecule contains structures that can absorbe light and therefore the value of the elute samples might only indicate the imidazole and not the protein conc in the sample. | ||
| + | |||
| + | ===Colony PCR=== | ||
| + | |||
| + | I PCR screened 16 colonies/dish of Protein A_LMWP_N, Protein A_TAT_N, Protein A_Tra10_N, Fusion_CPP1, Fusion_TAT_C & Fusion_CPP3. | ||
| + | |||
| + | The PCR protocol was according to previous ones where I added 25 ul PCR mix/PCR tube. | ||
| + | |||
| + | Elongation time for Protein A samples: 45 sec and for Fusion samples 2 min. | ||
| + | |||
| + | |||
| + | |||
| + | |||
| + | == Mimmi == | ||
| + | |||
| + | === clone non-CPP operon === | ||
| + | |||
| + | ==== Gel ==== | ||
| + | |||
| + | [[Image:2010-10-18_pEX.SOD.his.RBS.yCCS.jpg|200px|thumb|left|]] | ||
| + | {| | ||
| + | ! well | ||
| + | ! sample | ||
| + | |- | ||
| + | | 1 | ||
| + | | ladder | ||
| + | |- | ||
| + | | 2 | ||
| + | | pEX.SOD.his.RBS.yCCS 1 | ||
| + | |- | ||
| + | | 3 | ||
| + | | pEX.SOD.his.RBS.yCCS 2 | ||
| + | |- | ||
| + | | 4 | ||
| + | | pEX.SOD.his.RBS.yCCS 3 | ||
| + | |- | ||
| + | | 5 | ||
| + | | pEX.SOD.his.RBS.yCCS 4 | ||
| + | |- | ||
| + | | 6 | ||
| + | | pEX.SOD.his.RBS.yCCS 5 | ||
| + | |- | ||
| + | | 7 | ||
| + | | pEX.SOD.his.RBS.yCCS 6 | ||
| + | |- | ||
| + | | 8 | ||
| + | | pEX.SOD.his.RBS.yCCS 7 | ||
| + | |} | ||
| + | |||
| + | |||
| + | |||
| + | |||
| + | |||
| + | ==== Glycerol stock + plasmid prep ==== | ||
| + | |||
| + | *PEX.SOD.RBS.yCCS | ||
| + | *pEX.his.SOD.RBA.yCCS | ||
| + | |||
| + | *Follow E.T.Z.N.A plasmid mini prep. protocol | ||
| + | **Wash two times with DNA wash buffer | ||
| + | **Eluate two times in 70µl dH<sub>2</sub>O | ||
| + | |||
| + | *Add 1600µl culture to 400µl pre-sterilized glycerol | ||
| + | |||
| + | |||
| + | |||
| + | === SOD activity === | ||
| + | |||
| + | *Start up cultures | ||
| + | **SOD | ||
| + | **yCCS | ||
| + | |||
| + | *At OD=0.6, add IPTG 1mM | ||
| + | **SOD | ||
| + | **yCCS | ||
| + | |||
| + | *Take 4ml samples at 0h, 1h and 2h | ||
| + | **SOD | ||
| + | **SOD uninduced | ||
| + | **yCCS | ||
| + | |||
| + | *Spinn down cells and resuspend in 2ml phosphate buffer, pH=7.0 | ||
| + | |||
| + | *Sonicate 3x30s at ~12amp | ||
| + | |||
| + | =Johan= | ||
| + | |||
| + | ==PCR== | ||
| + | |||
| + | PCR of the last constructs, tat-bFGF-his, his-bFGF and bFGF-his | ||
| + | |||
| + | 0,5 µl Pol | ||
| + | 0,5 µl dNTP | ||
| + | 5 µl buffer | ||
| + | 1 µl pex for primer | ||
| + | 1 µl pex rev primer | ||
| + | 17 µl H2O | ||
| + | |||
| + | 30X mix, 10 colonies of each plate | ||
| + | |||
| + | ==Gel== | ||
| + | |||
| + | tat-bFGF-his: | ||
| + | |||
| + | [[Image:SU 18oktgels.png]] | ||
| + | |||
| + | Top: his-bFGF, bottom: bFGF-his | ||
| + | |||
| + | [[Image:SU 18oktgels 1.png]] | ||
| + | |||
| + | Suprisingly many correct colonies on tat-bFGF-his, one of both bFGF-his and his-bFGF. | ||
| + | |||
| + | Made overnight culture of 2 colonies from tat-bFGF-his and 1 colony of bFGF-his and his-bFGF. | ||
| + | |||
| + | ==Transformation== | ||
| + | |||
| + | Transformed sequenced miniprep of tra10-bFGF-his, lmwp-bFGF-his, his-bFGF-tra10, his-bFGF-tat & his-bFGF-lmwp into BL21 cells. | ||
| + | |||
| + | ==Ninas PCR== | ||
| + | |||
| + | Helped Nina with her HUGE pcr (100 colonies) | ||
| + | |||
| + | {{Stockholm/Footer}} | ||
Latest revision as of 19:30, 27 October 2010
Contents |
Andreas
Transfer of ProtA⋅His to pEX
Digestion
| Sample | |
|---|---|
| 10X FastDigest buffer | 1 |
| Plasmid DNA | 7 |
| dH2O | 0 |
| FD XbaI | 1 |
| FD PstI | 1 |
| 10 μl |
- Incubation: 37 °C, 0:30
- Inactivation: 80 °C, 3:00
De-phosphorylated pre-digested/extracted pEX vector:
- 8 μl extracted and digested (X+P) pEX vector DNA
- 1 μl FD buffer
- 1 μl FastAP (alkaline phosphatase)
- Incubation: 37 °C, 0:30
- Inactivation: 80 °C, 3:00
Ligation
| 10X T4 Ligase buffer | 2 |
| Vector DNA | 1 |
| Insert DNA | 11 |
| dH2O | 5 |
| T4 DNA ligase | 1 |
| 20 μl |
|---|
- Incubation: 22 °C, 1 h
Transformation
Including three more transformations
Modified quick-transformation protocol:
- 30 min on ice
- 50 μl BL21
- 2 μl pEX.ProtA⋅his ligation mix
- 0.5 μl pEX.IgGp
- 0.5 μl pEX.SOD.RyC
- 0.5 μl pEX.hS.RyC
PCR verification for Uppsala-Sweden team
Helping the Uppsala team with a PCR verification of one of their assemblies.
Summed up their total construct length in pSB1x3 to 6566 bp.
- K1: C2 & C4 (x2)
- K2: C2 & C5 (x2)
Standard colony PCR settings:
- Elongation time: 10 min
- Annealing temp: 55 °C and 60 °C
PCR run ON.
Nina
Polyacrylamide gel on SOD
I ran a polyacrylamide gel on SOD that I have tried to get pure.
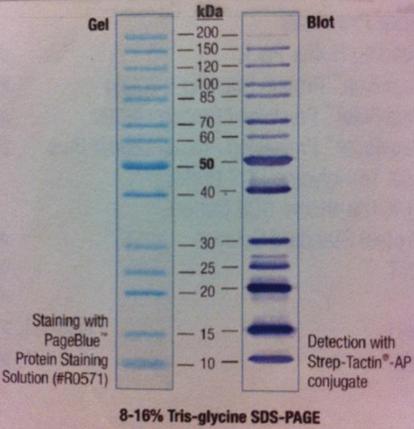
Ladder: PageRuler Unst. Protein Ladder Fermentas
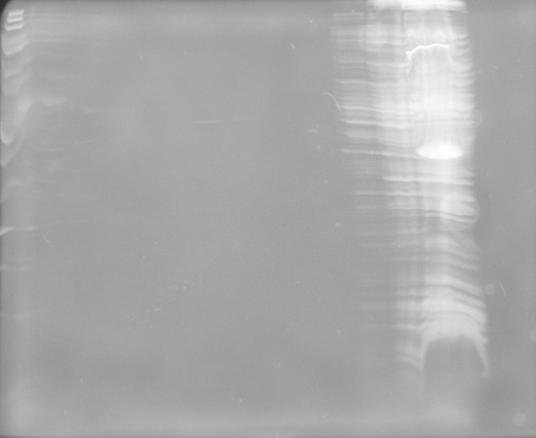
Arragement on gel:
I had a Coomassie blue staning and destaining on the gel.
Protein concentration
I measured the protein conc on the samples: unbound, wash 1-3, elute 1-4 and not pure to check if I had any proteins. I had to test this since the gel shows that I don't have any proteins, even not much in the unbound lane, which should have a lot of bands. It could also be that my samples that I loaded onto the gel was very diluted since I had fractions consisting of 10 ml solution. This could give me an indication wheter I need to concentrate my fractions with a Millipore centrifugation.
I measured the concentrations using a BSA-method.
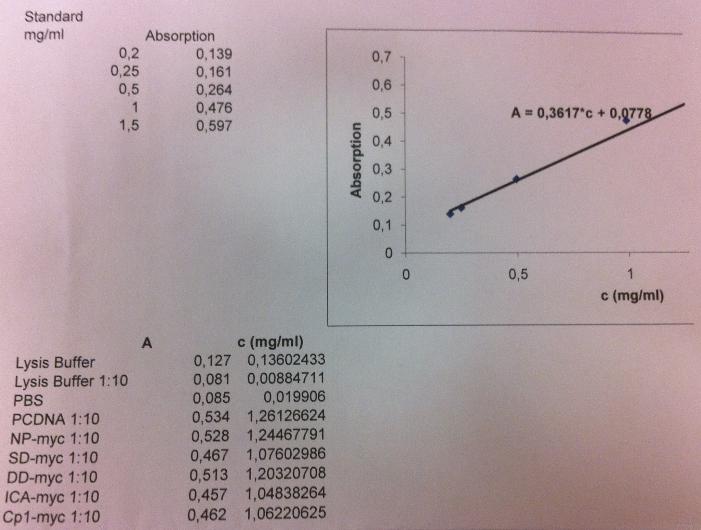
I got a standard curve from another student (Annika) in the lab I work in.
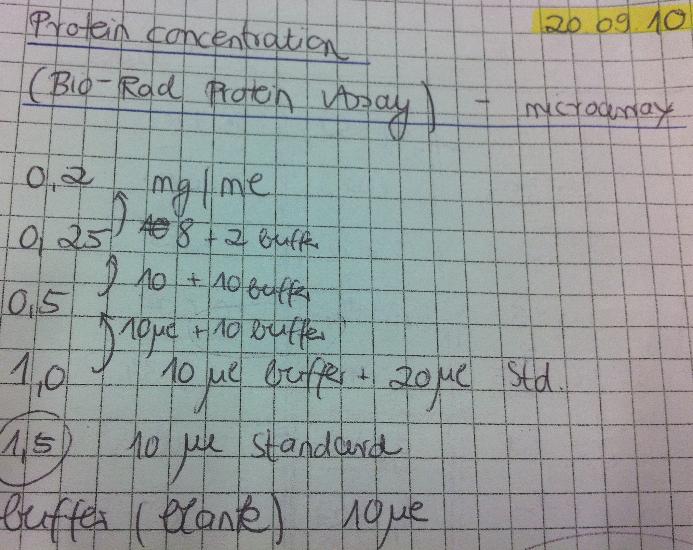
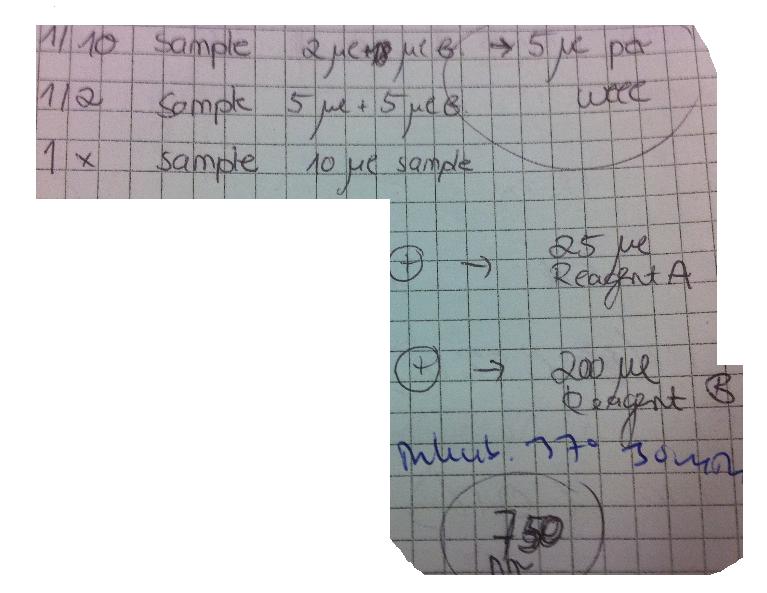
The standard curve was obtained by following this:
I measured the conc by following these instructions:
I got these absorbance values for each well I loaded:
Samples from top to bottom: unbound, wash 1-3, elute 1-4.
From the standard curve I can calculate the protein concentration:
A = 0.3617 * C + 0.0778
C = (A-0.0778)/0.3617
However I realized that the blank I used did not have any imidazole added, this is therefore not a good control for the elute samples since they contain a high amount of imidazole.
The imidazole molecule contains structures that can absorbe light and therefore the value of the elute samples might only indicate the imidazole and not the protein conc in the sample.
Colony PCR
I PCR screened 16 colonies/dish of Protein A_LMWP_N, Protein A_TAT_N, Protein A_Tra10_N, Fusion_CPP1, Fusion_TAT_C & Fusion_CPP3.
The PCR protocol was according to previous ones where I added 25 ul PCR mix/PCR tube.
Elongation time for Protein A samples: 45 sec and for Fusion samples 2 min.
Mimmi
clone non-CPP operon
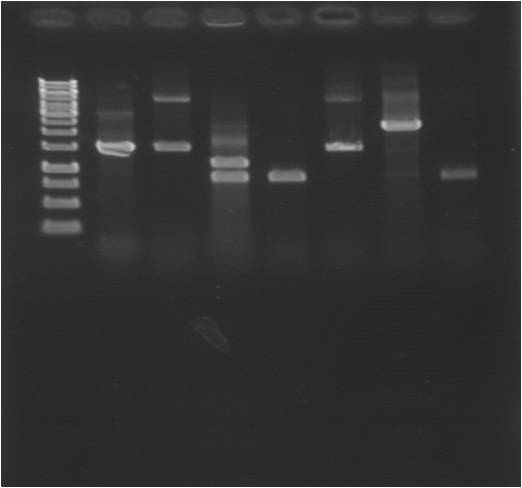
Gel
| well | sample |
|---|---|
| 1 | ladder |
| 2 | pEX.SOD.his.RBS.yCCS 1 |
| 3 | pEX.SOD.his.RBS.yCCS 2 |
| 4 | pEX.SOD.his.RBS.yCCS 3 |
| 5 | pEX.SOD.his.RBS.yCCS 4 |
| 6 | pEX.SOD.his.RBS.yCCS 5 |
| 7 | pEX.SOD.his.RBS.yCCS 6 |
| 8 | pEX.SOD.his.RBS.yCCS 7 |
Glycerol stock + plasmid prep
- PEX.SOD.RBS.yCCS
- pEX.his.SOD.RBA.yCCS
- Follow E.T.Z.N.A plasmid mini prep. protocol
- Wash two times with DNA wash buffer
- Eluate two times in 70µl dH2O
- Add 1600µl culture to 400µl pre-sterilized glycerol
SOD activity
- Start up cultures
- SOD
- yCCS
- At OD=0.6, add IPTG 1mM
- SOD
- yCCS
- Take 4ml samples at 0h, 1h and 2h
- SOD
- SOD uninduced
- yCCS
- Spinn down cells and resuspend in 2ml phosphate buffer, pH=7.0
- Sonicate 3x30s at ~12amp
Johan
PCR
PCR of the last constructs, tat-bFGF-his, his-bFGF and bFGF-his
0,5 µl Pol 0,5 µl dNTP 5 µl buffer 1 µl pex for primer 1 µl pex rev primer 17 µl H2O
30X mix, 10 colonies of each plate
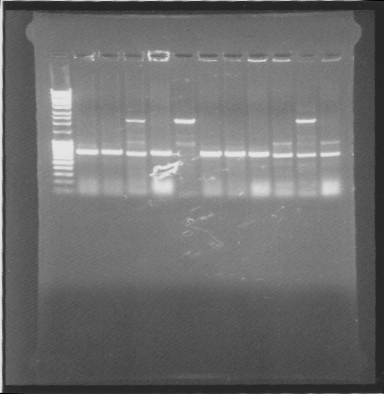
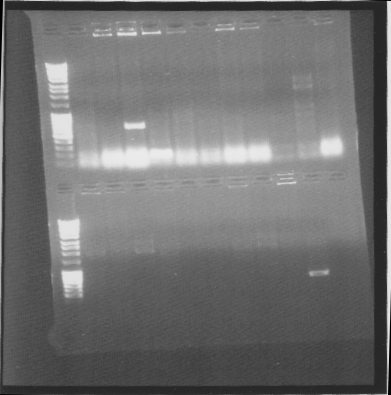
Gel
tat-bFGF-his:
Top: his-bFGF, bottom: bFGF-his
Suprisingly many correct colonies on tat-bFGF-his, one of both bFGF-his and his-bFGF.
Made overnight culture of 2 colonies from tat-bFGF-his and 1 colony of bFGF-his and his-bFGF.
Transformation
Transformed sequenced miniprep of tra10-bFGF-his, lmwp-bFGF-his, his-bFGF-tra10, his-bFGF-tat & his-bFGF-lmwp into BL21 cells.
Ninas PCR
Helped Nina with her HUGE pcr (100 colonies)
 |

|
 |

|
 |

|

|

|
 "
"


