Team:Stanford/Digital Sensor
From 2010.igem.org
Karpadillo (Talk | contribs) (→Flow Cytometry Data) |
Karpadillo (Talk | contribs) (→Overview) |
||
| (2 intermediate revisions not shown) | |||
| Line 8: | Line 8: | ||
Our first sensor design is tuned to a '''single ratio''' of input chemicals and tells the user if the input chemicals are present in relative concentrations '''below''', '''at''', or '''above''' that ratio. | Our first sensor design is tuned to a '''single ratio''' of input chemicals and tells the user if the input chemicals are present in relative concentrations '''below''', '''at''', or '''above''' that ratio. | ||
| - | + | L-arabinose binds to pBAD (BBa_I0500) which promotes the transcription of sRNA2, RSID1, and GFP. AHL binds to pLUX (BBa_F2620), which promotes the transcription of sRNA1, RSID2, and RFP. In the cytoplasm, each sRNA binds to its respective RSID before translation occurs. Ribosomes are prevented from binding to those mRNA's that are bound by sRNA's, meaning that only those mRNA's that remain unbound by sRNA's get translated into reporter protein. sRNA/mRNA dimers are eventually degraded by the cell's machinery. | |
| - | If the concentration of | + | If the concentration of L-arabinose is greater than that of AHL, more sRNA2 and GFP will be produced than sRNA1 and RFP. This means that each sRNA1 will be able to bind to a copy of RSID1, while there will not be enough sRNA2 to inhibit all of the RFP. An excess of L-arabinose therefore leads to an expression of GFP. |
To change the threshold ratio detected by the sensor, multiple copies of the genes encoding either the mRNA or the sRNA can be placed downstream of the promoters. | To change the threshold ratio detected by the sensor, multiple copies of the genes encoding either the mRNA or the sRNA can be placed downstream of the promoters. | ||
| Line 44: | Line 44: | ||
===Flow Cytometry Data=== | ===Flow Cytometry Data=== | ||
| - | [[Image:realdata.jpg|frame|none|Flow Cytometry Data for part K353002]] | + | [[Image:realdata.jpg|frame|none|Flow Cytometry Data for part K353002]] <br> |
| + | Both of these graphs plot the output of part K353002 in BW27783 cells induced with a series of concentrations of L-arabinose, measured in molarity. The first is a histogram showing the distribution of expression levels at each concentration of L-arabinose. The second is the same data displayed as a cumulative distribution so that population medians are more apparent. | ||
| - | + | [[Image:Flow_data.jpg]] <br> | |
| + | We measured a dose-response-curve of median output vs L-arabinose concentration in triplicate. This curve constitutes the basic characterization of part K353002, including measurement of the concentration of L-arabinose which gives half-maximal output, the steepness of transition from off to on, and the parts dynamic range. Fitting a Hill curve provided the following values plus or minus 95% confidence intervals: <br> | ||
*Half-max induction: 143 +- 36 uM | *Half-max induction: 143 +- 36 uM | ||
*Hill coefficient: 1.4 +- .6 | *Hill coefficient: 1.4 +- .6 | ||
*Fold Induction: 860 | *Fold Induction: 860 | ||
| - | |||
| - | |||
| - | |||
</div> | </div> | ||
Latest revision as of 02:59, 28 October 2010

| Home | Project | Applications | Modeling | Parts | Team | Notebook |
Contents |
The sRNA Sensor
Overview
Our first sensor design is tuned to a single ratio of input chemicals and tells the user if the input chemicals are present in relative concentrations below, at, or above that ratio.
L-arabinose binds to pBAD (BBa_I0500) which promotes the transcription of sRNA2, RSID1, and GFP. AHL binds to pLUX (BBa_F2620), which promotes the transcription of sRNA1, RSID2, and RFP. In the cytoplasm, each sRNA binds to its respective RSID before translation occurs. Ribosomes are prevented from binding to those mRNA's that are bound by sRNA's, meaning that only those mRNA's that remain unbound by sRNA's get translated into reporter protein. sRNA/mRNA dimers are eventually degraded by the cell's machinery.
If the concentration of L-arabinose is greater than that of AHL, more sRNA2 and GFP will be produced than sRNA1 and RFP. This means that each sRNA1 will be able to bind to a copy of RSID1, while there will not be enough sRNA2 to inhibit all of the RFP. An excess of L-arabinose therefore leads to an expression of GFP.
To change the threshold ratio detected by the sensor, multiple copies of the genes encoding either the mRNA or the sRNA can be placed downstream of the promoters.
By sensing only one ratio, we gain a sharp transition between no signal and a lot of signal. This allows us to insulate our output from biological noise in all regimes of the input domain except for the small neighborhood surrounding the sharp transition.
By engineering readout redundancy into the sRNA sensor, we have insulated our sensor from detector-specific readout noise. If there were only one color, we would register the transition from off -> on whenever the signal exceeded the signal/noise ratio of our detector. This means that we would actually read the off/on transition as occurring at different points in the input domain with different detectors! But with two colors, (one transitioning from off -> on, the other from on -> off), we can set the detection threshold far above our detector's S/N threshold, and average the transition point in the two channels to achieve a detector-independent measurement of the specified ratio.
Read about our other sensor or return to our project page.
The RSID: Improving sRNA Interference
Our system uses sRNA interference, which is usually a non-modular operation. Because each sRNA must be complementary to the mRNA sequence of the protein it inactivates, changing outputs in a traditional sRNA interference system would require designing and inserting a new sRNA for each output. To overcome this design flaw and make our sensor more easily modified, we implemented a novel control system for sRNA interference: the RSID.
The RSID is a synthetically-created DNA sequence that includes a ribosome binding site, and is inserted upstream of the output proteins. Each sRNA recognizes and binds to a specific RSID, covering the RBS contained within it and preventing the translation of the downstream output protein.
Because the RSID's are independent from the output protein, new output proteins may be inserted without affecting the performance or design of the internal mechanism. This feature allows our system to be modified by future users to release any necessary output protein.
In choosing the sequence of our RSID's and sRNA's, we were careful to avoid several possible pitfalls. Our sRNA's and RSID's are all non-complementary to anything in the host cell's genome in order to avoid accidentally inhibiting important cell processes. In addition, we screened our designs to make sure they had low levels of self-dimerization, which would limit their effectiveness.
Our RSID's are valuable parts in their own right, as they can be applied to any other projects employing sRNA interference to yield similar modularity and precision targeting.
Device and Parts Level Diagrams

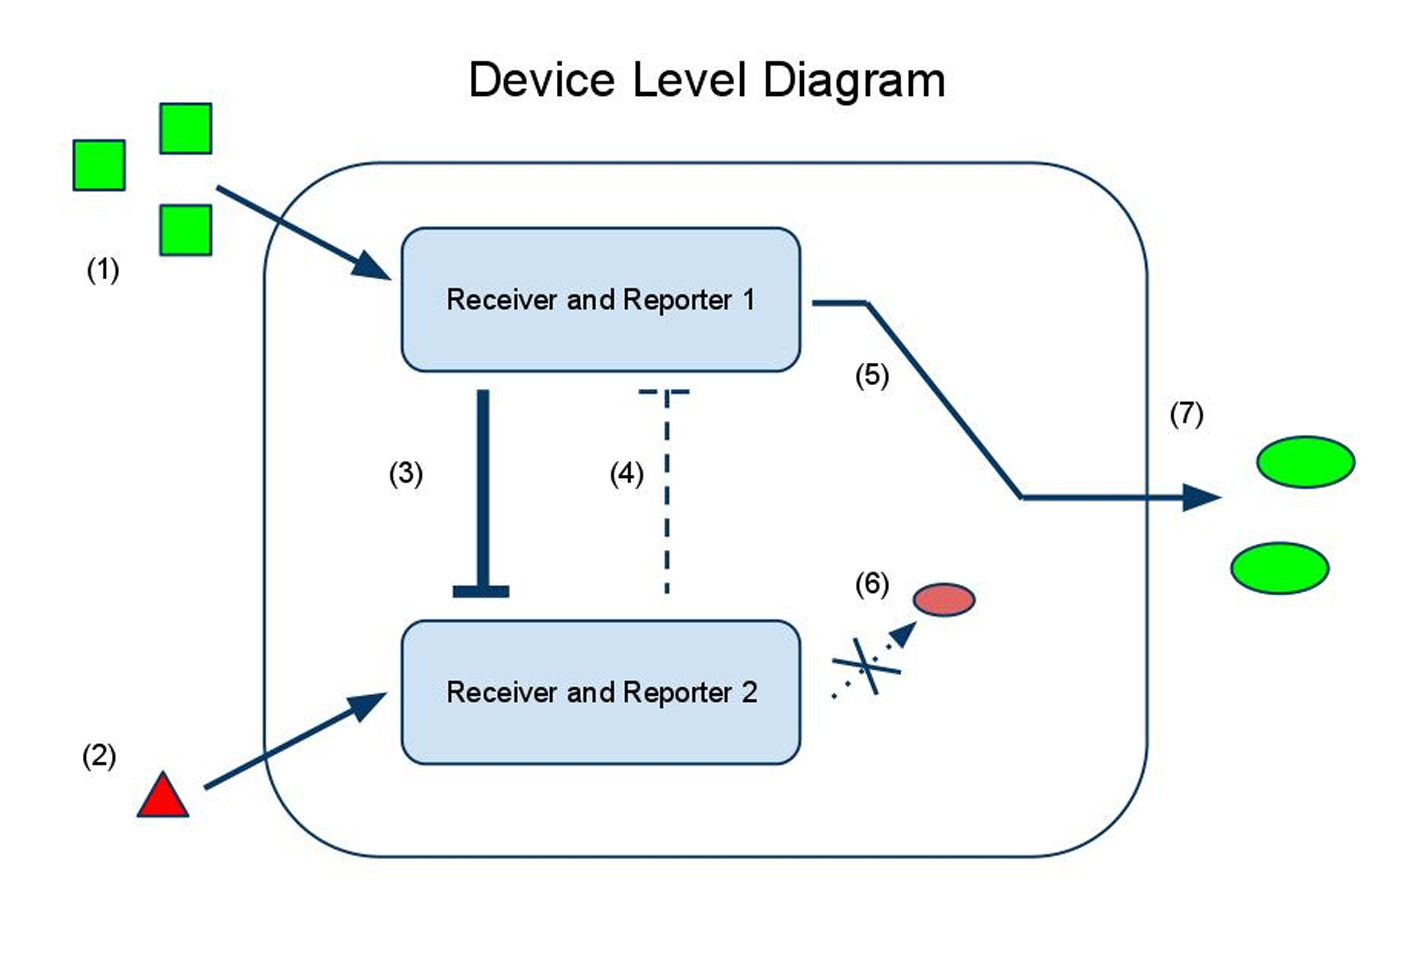
(1) Input A activates Receiver and Reporter 1. (2) Input B activates Receiver and Reporter 2. (3) There is more input A, so Receiver and Reporter 1 will strongly repress Receiver and Reporter 2. (4) There is less input B, so the repression going the other way is weaker. (5) This leads to the production of output A, and (6) little to no production of output B. (7) The output of the device is either dominated by output A or output B. By seeing which is the case, we can infer whether input A or input B was present in greater amounts.

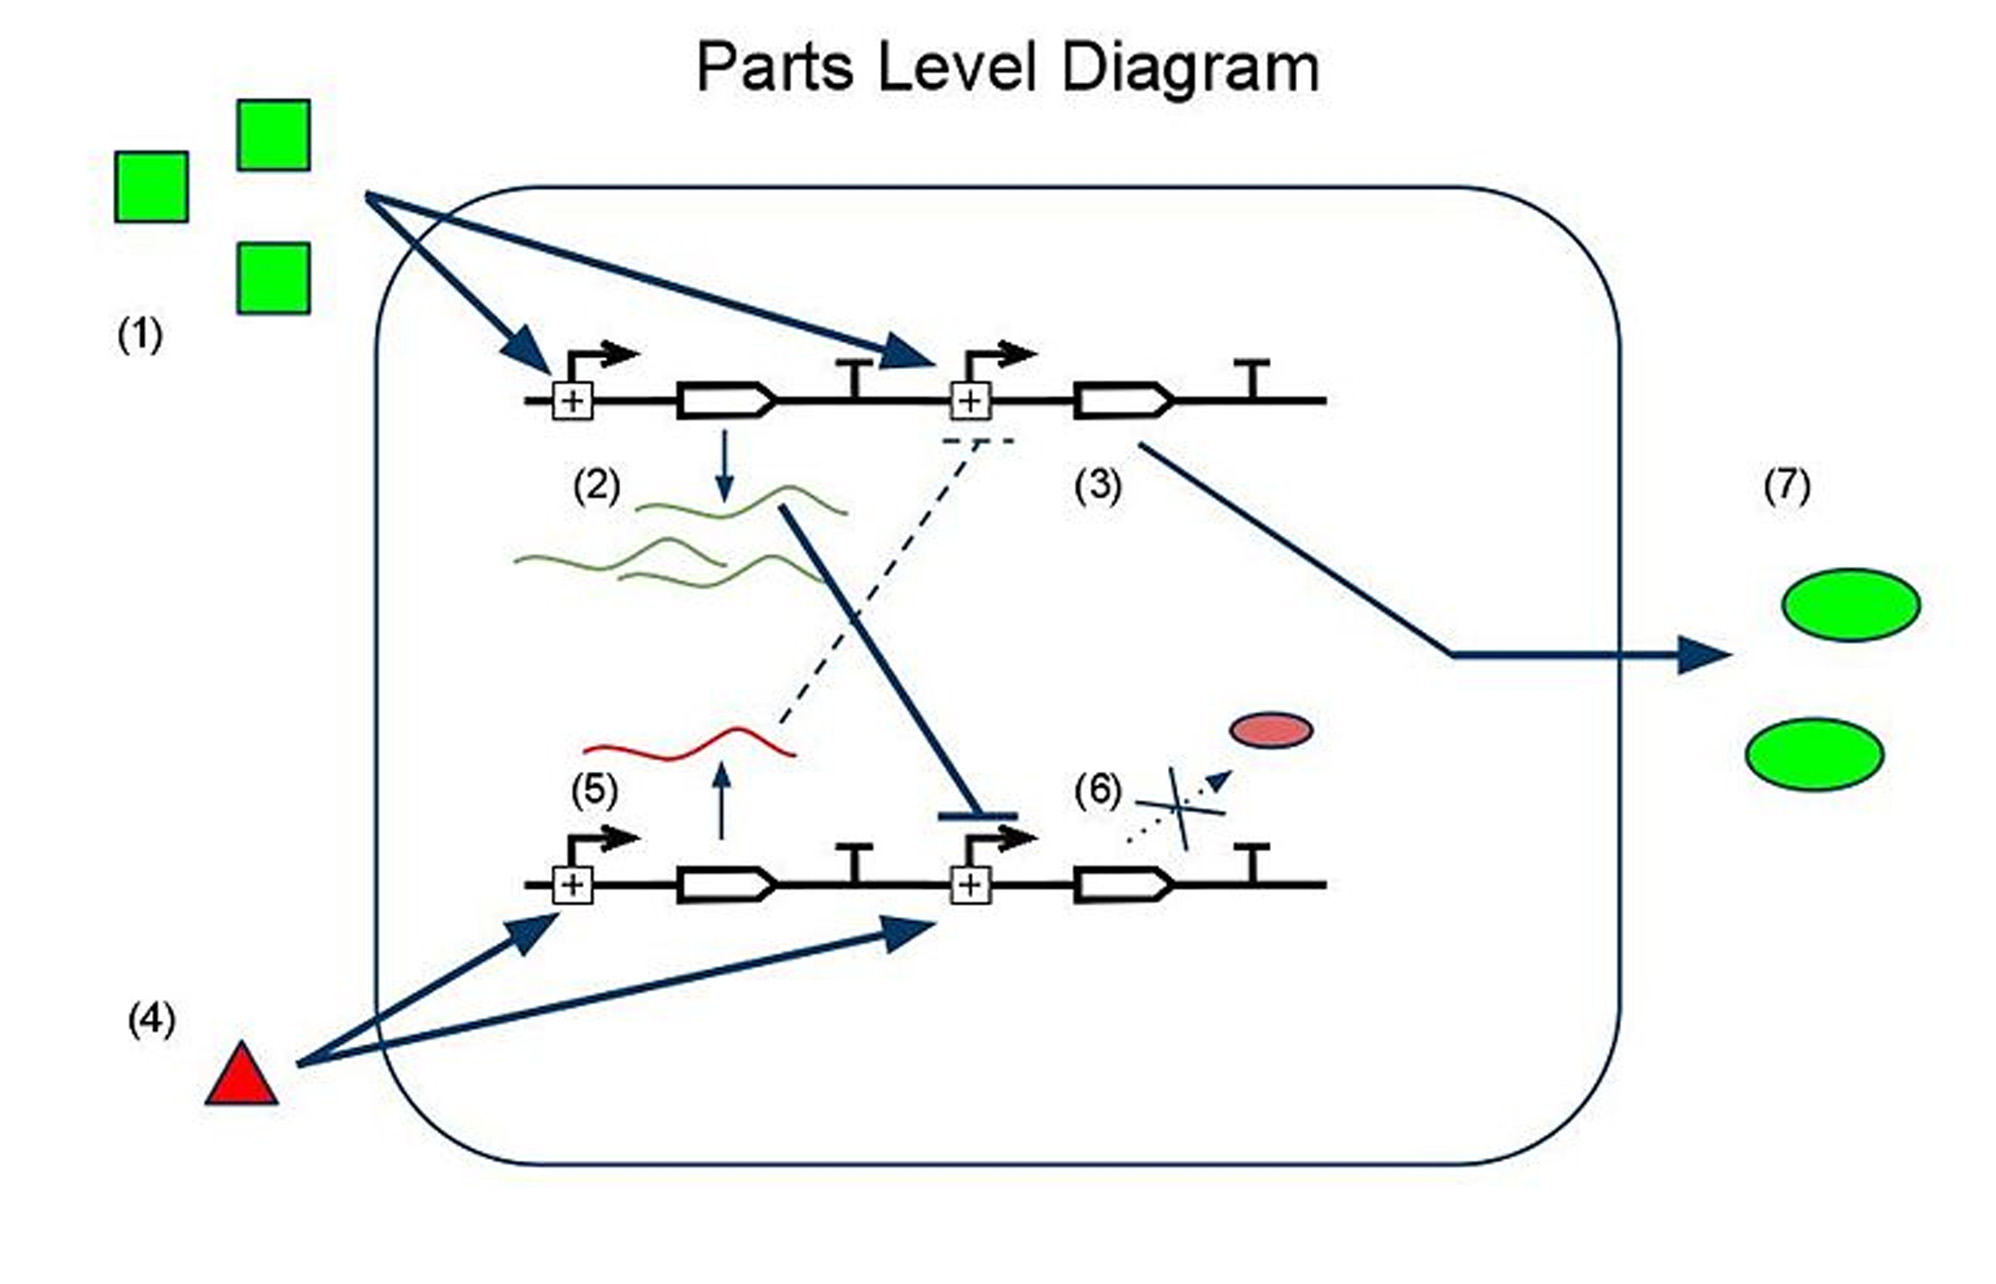
(1) Input A leads to the transcription of (2) GFP mRNA and (3) sRNA targeting RFP mRNA. This is how we implement both reporting and repressing outputs as a result of sengins input A. (4) Input B leads to two similar transcription events: (5) RFP mRNA and (6) sRNA targeting GFP mRNA. In this scenario, because there is more input A than input B, the GFP mRNA is translated whereas the RFP mRNA is silenced by its respective sRNA, thus leading to (7) a device output that is clearly more green than red, reflecting the relative levels of input A to input B.
Flow Cytometry Data
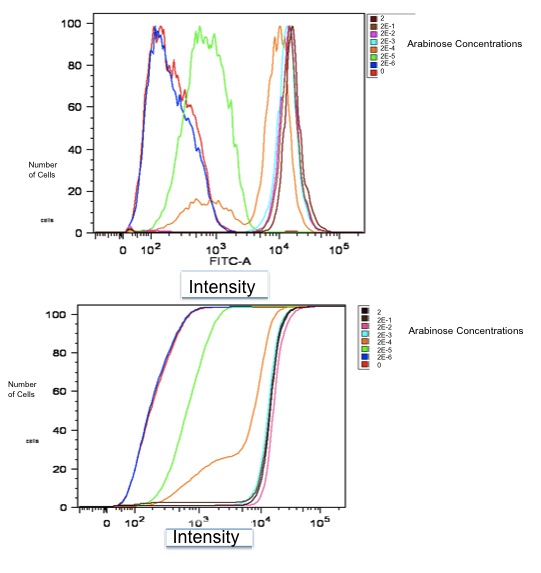
Both of these graphs plot the output of part K353002 in BW27783 cells induced with a series of concentrations of L-arabinose, measured in molarity. The first is a histogram showing the distribution of expression levels at each concentration of L-arabinose. The second is the same data displayed as a cumulative distribution so that population medians are more apparent.

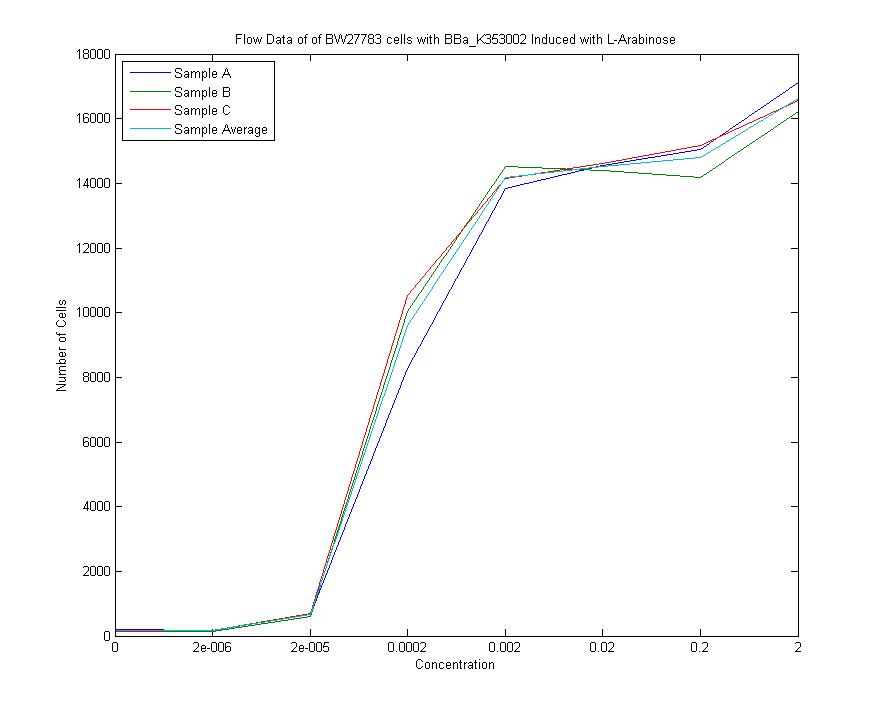
We measured a dose-response-curve of median output vs L-arabinose concentration in triplicate. This curve constitutes the basic characterization of part K353002, including measurement of the concentration of L-arabinose which gives half-maximal output, the steepness of transition from off to on, and the parts dynamic range. Fitting a Hill curve provided the following values plus or minus 95% confidence intervals:
- Half-max induction: 143 +- 36 uM
- Hill coefficient: 1.4 +- .6
- Fold Induction: 860
 "
"
