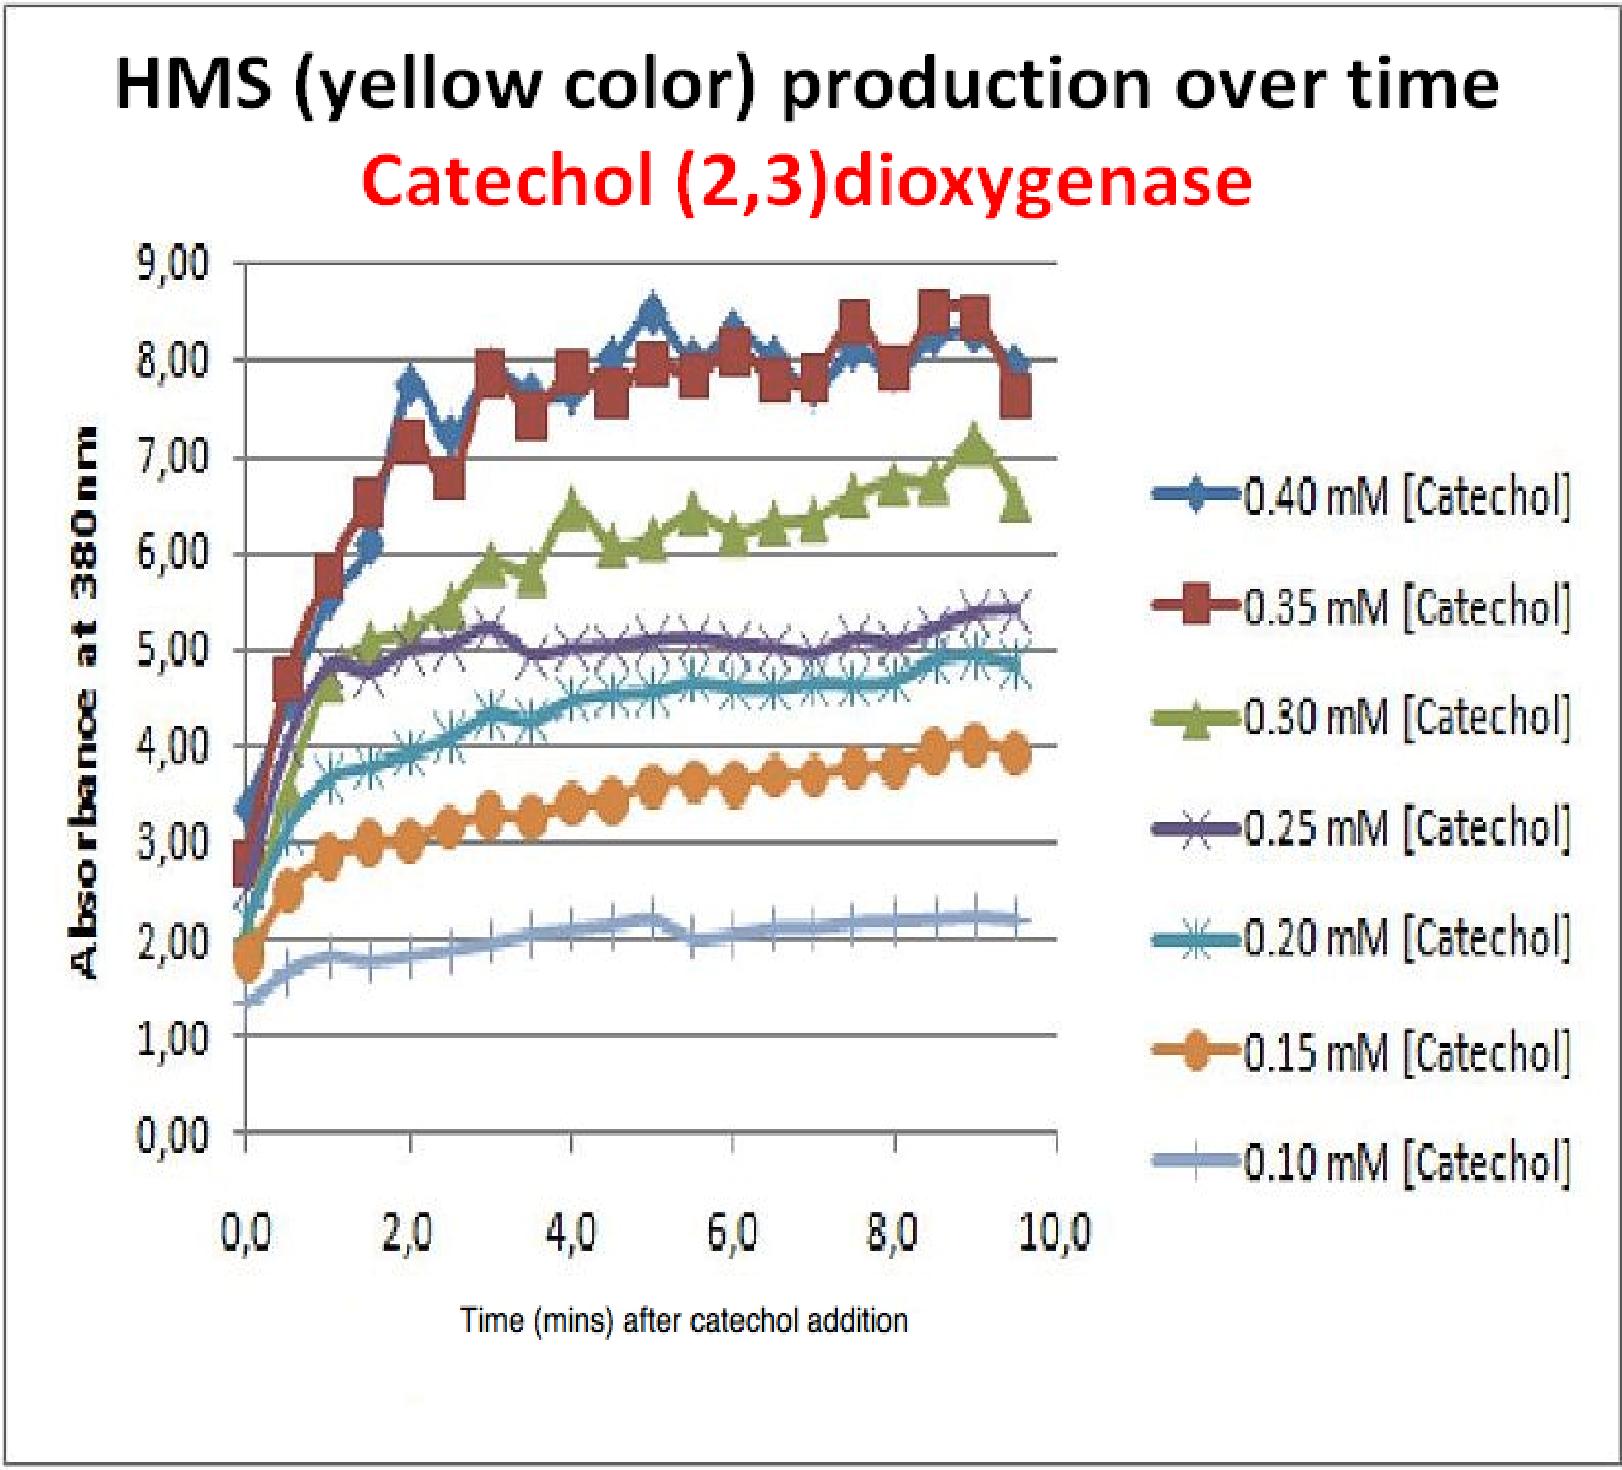
File:HMS prod. over time curve for xylE.jpg
From 2010.igem.org
(Difference between revisions)
(uploaded a new version of "Image:HMS prod. over time curve for xylE.jpg") |
(uploaded a new version of "Image:HMS prod. over time curve for xylE.jpg") |
| (One intermediate revision not shown) | |
Latest revision as of 16:58, 27 October 2010
File history
Click on a date/time to view the file as it appeared at that time.
| Date/Time | Thumbnail | Dimensions | User | Comment | |
|---|---|---|---|---|---|
| current | 16:58, 27 October 2010 |  | 1,622×1,470 (240 KB) | Nk08 (Talk | contribs) | |
| 14:49, 26 October 2010 |  | 795×600 (409 KB) | Mlr107 (Talk | contribs) | ||
| 14:46, 26 October 2010 |  | 795×600 (111 KB) | Mlr107 (Talk | contribs) | ||
| 15:24, 23 October 2010 |  | 978×738 (99 KB) | Nk08 (Talk | contribs) |
File links
The following 3 pages link to this file:
 "
"