Results usu.html
From 2010.igem.org
| Line 54: | Line 54: | ||
[[Image:USU_Promoter_Expression.png]] | [[Image:USU_Promoter_Expression.png]] | ||
| - | |||
| + | =Team Parts= | ||
| + | |||
| + | <groupparts>iGEM010 Utah_State</groupparts> | ||
</div> | </div> | ||
{{:Team:Utah_State/usu_footer}} | {{:Team:Utah_State/usu_footer}} | ||
Revision as of 15:33, 27 October 2010
Results
Contents |
Synechocystis Promoter Expression in E. coli
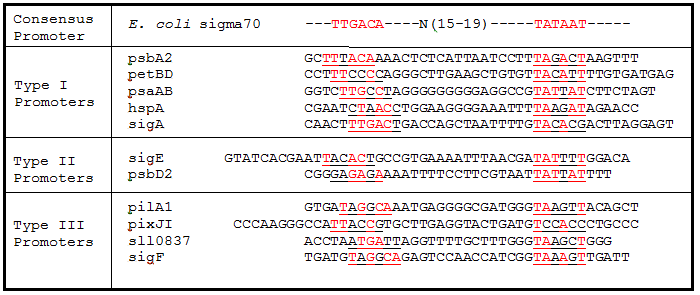
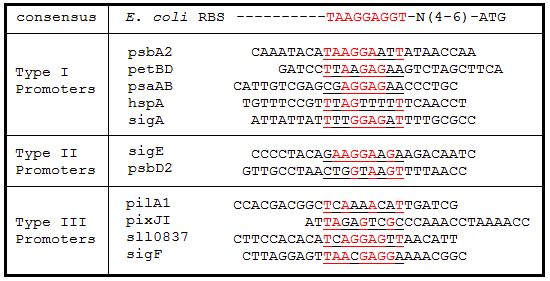
Promoter regions, 5’ Untranslated regions (5’UTR), and ribosome binding sites (RBS) from 11 Synechocystis genes were cloned in upstream of GFP. These protein generators were tested for their function in E. coli, due to the similarity of the sigma factor binding sites and RBS sequences from Synechocystis to the consensus promoter and RBS in E. coli (Tables 1 and 2).
Table 1. Sigma factor binding site alignments. Underlined sequences are the binding region for sigma70 sigma factor from E. coli. Bases in red are exact matches to the consensus sequence.
Table 2. Ribosome binding site sequence alignments. The regions 25 bp upstream of the start codon for each gene were aligned to the E. coli consensus RBS sequence. Underlined sequences are the binding region for the 9 bp 3’ end of the 16S rRNA subunit in E. coli. Bases in red are exact matches to the consensus sequence.
Preliminary Analysis
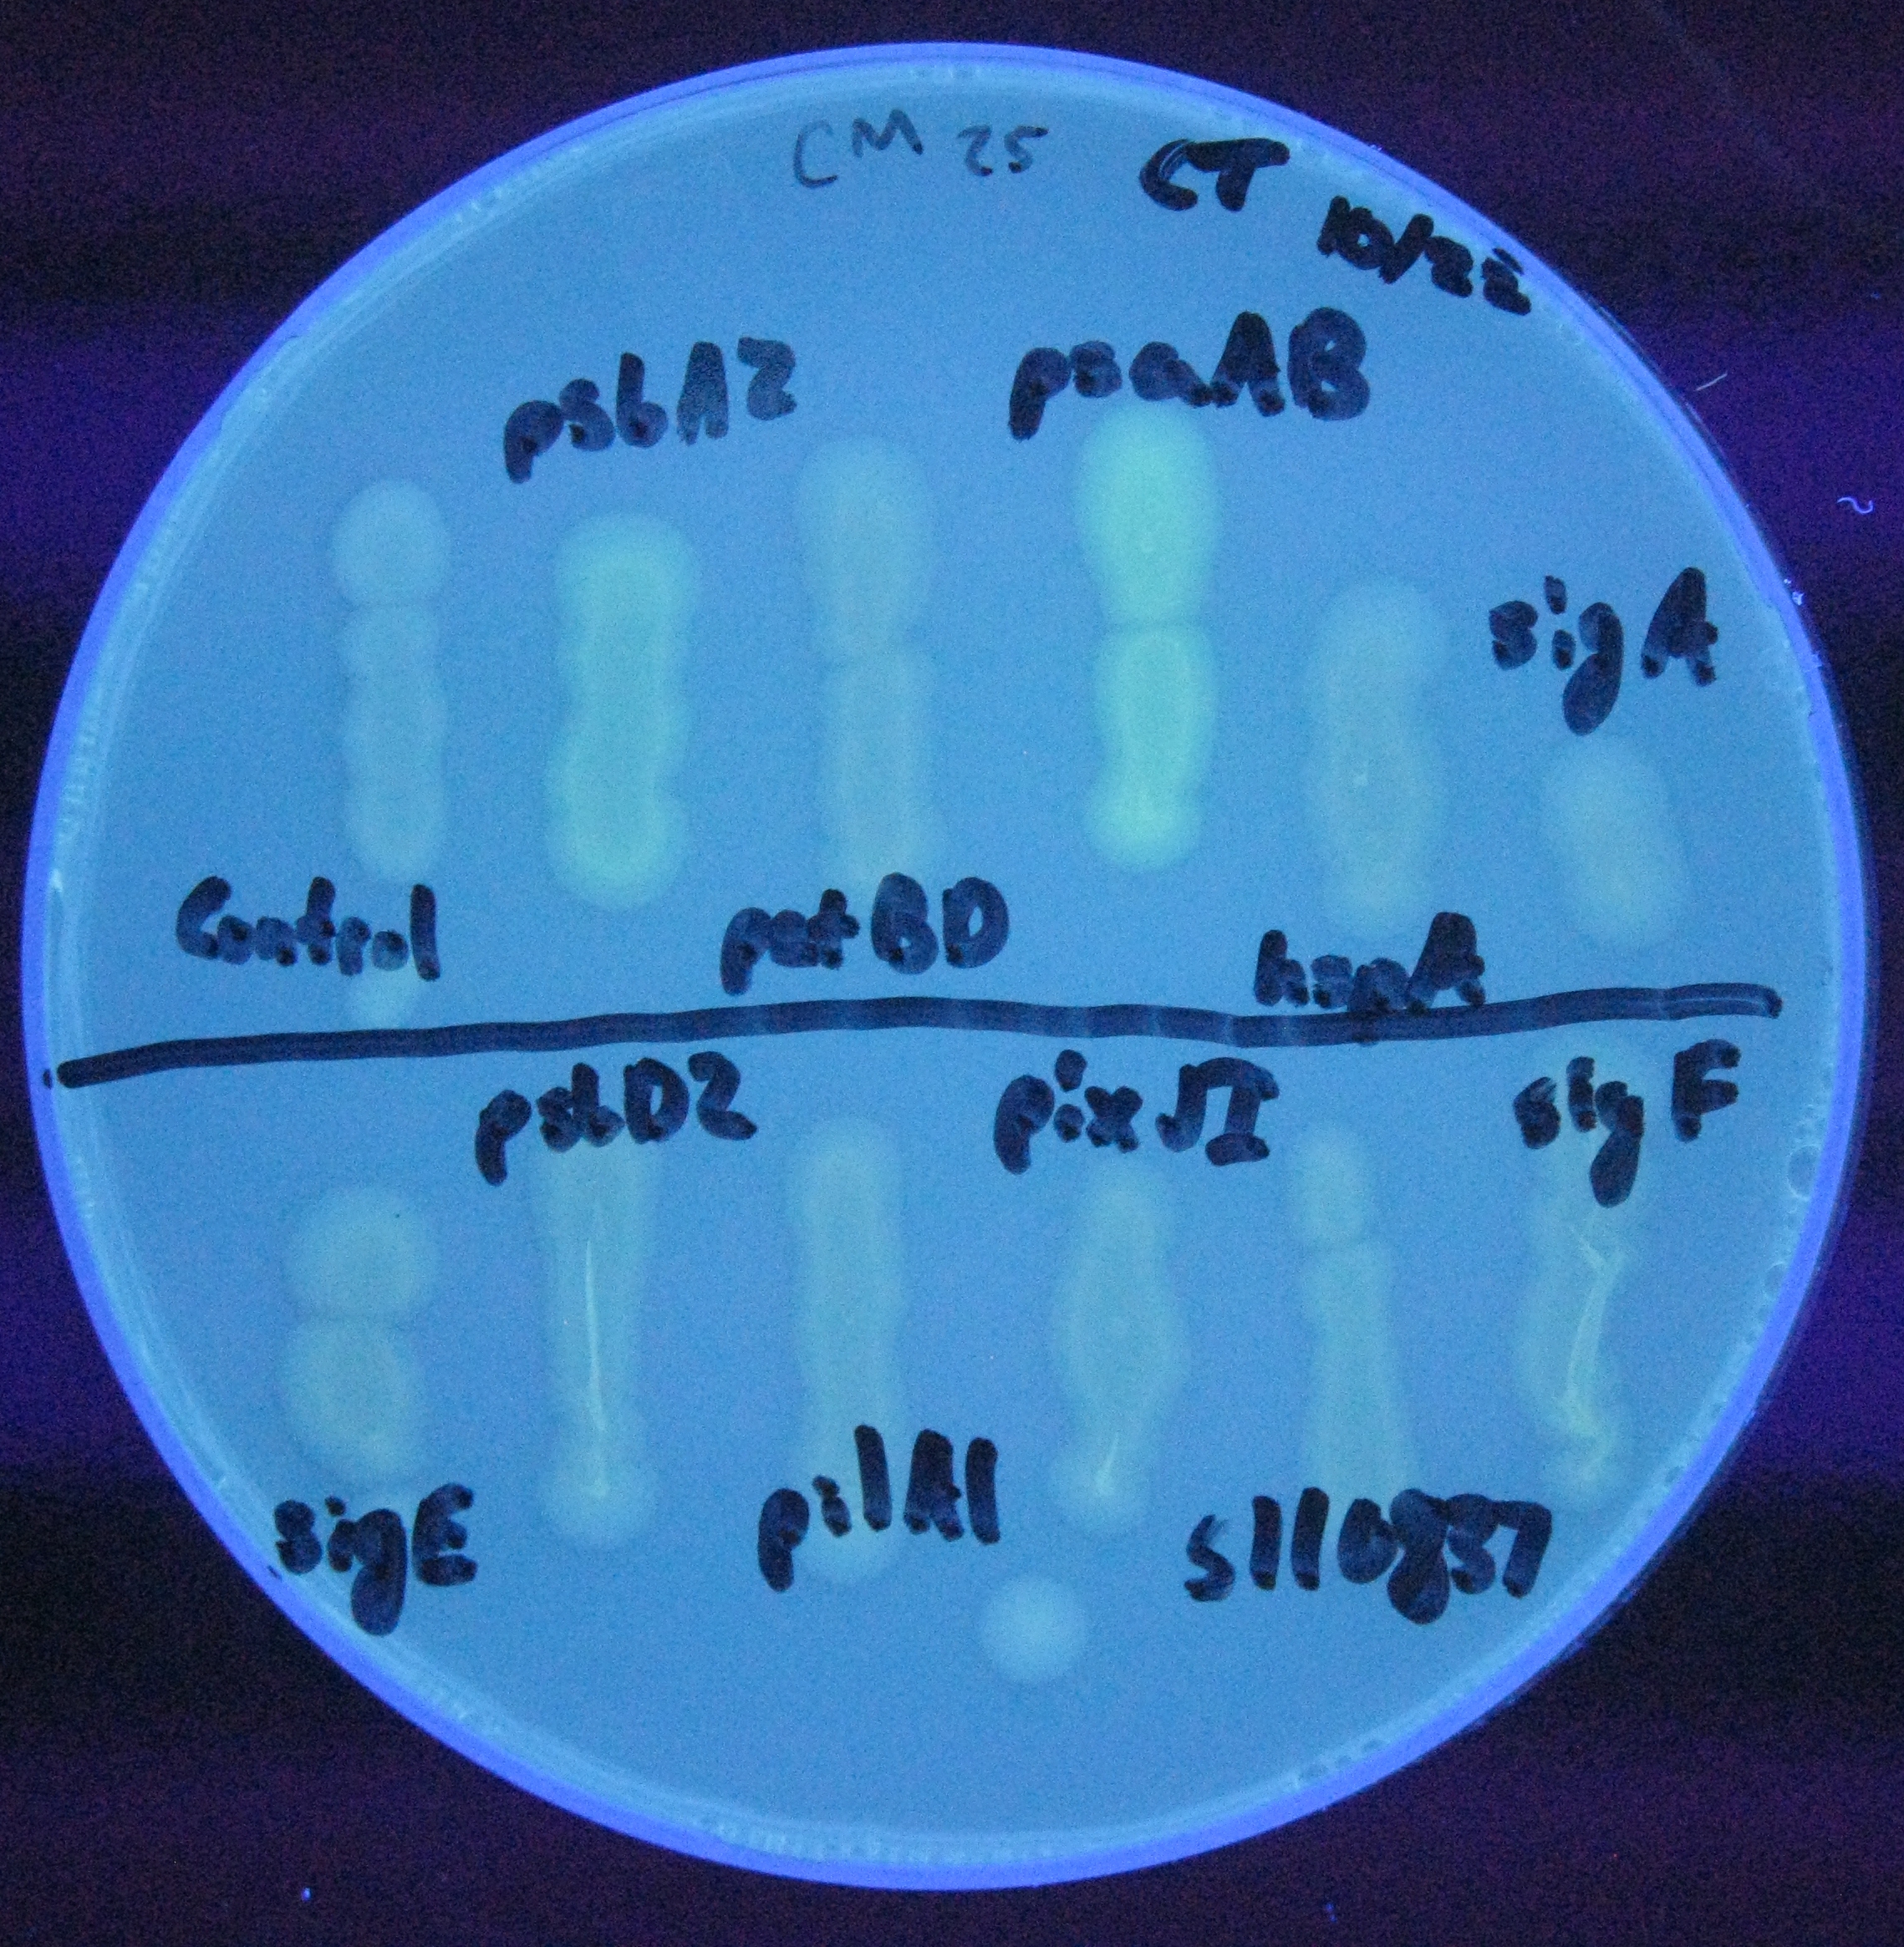
For our initial analysis, we plated small amounts of each of the transformed cells onto LB agar plates, and visually checked for GFP expression after 24 hours growth. GFP expression was clearly observed in the psaAB and psbA2 constructs, with the psaAB construct exhibiting the highest level of fluorescence (Figure 1).
Figure 1. Cell plating of Synechocystis promoters driving GFP expression in E. coli.
Fluorometer Analysis
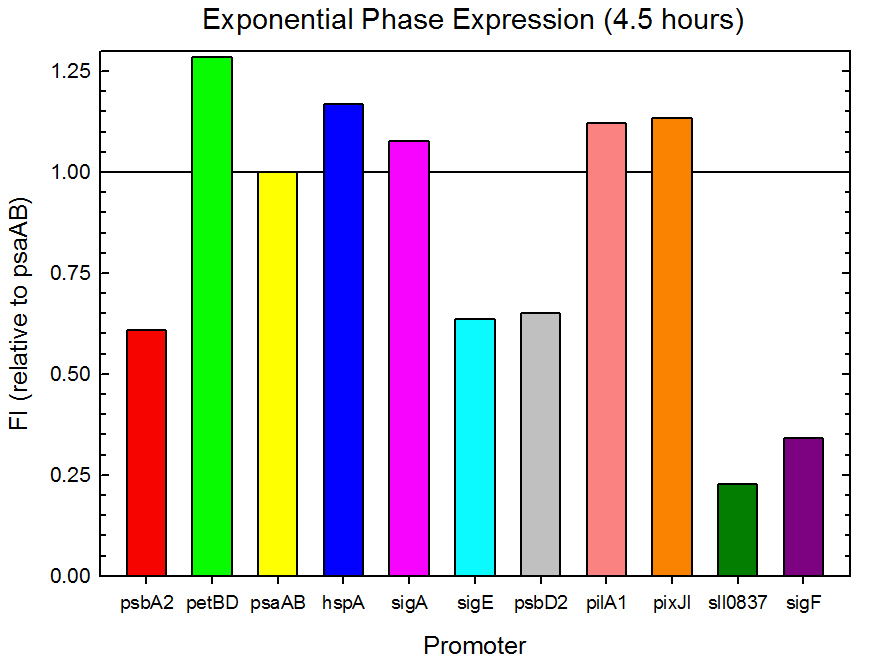
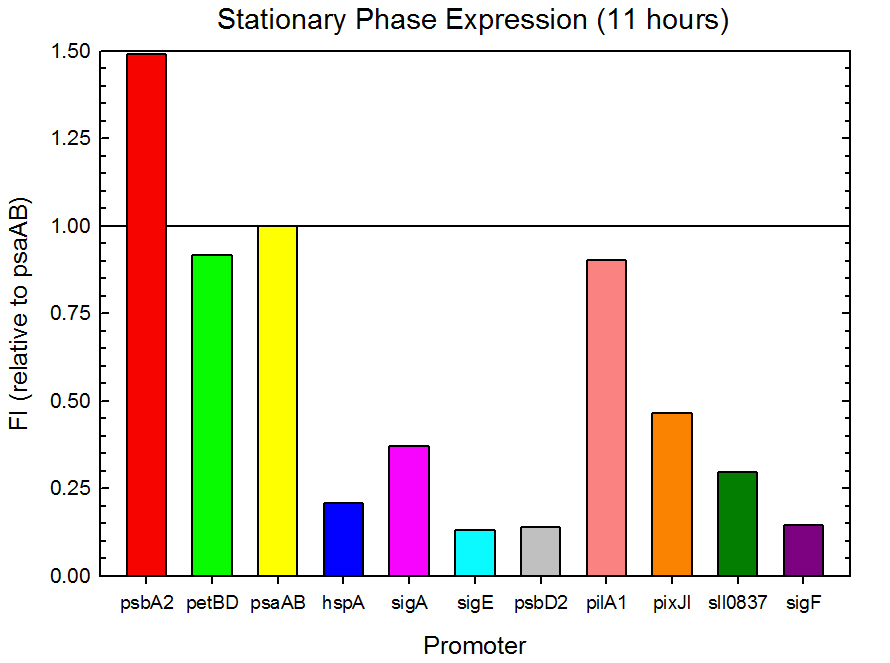
Fluorometer analysis of the 11 Synechocystis promoter, 5’UTR, and RBS regions in front of GFP was conducted as described in the Procedures section. Measurements were taken every 30 minutes and expression levels at the midpoints of exponential and stationary phase are shown in Figures 2 and 3. Since psaAB exhibited fluorescence during the preliminary analysis and was observed to be nearly constant across the fluorometer measurements, it was used as the standard, and all fluorescence values were calculated relative to its expression level.
Figure 2. Exponential phase GFP expression relative to psaAB expression for 11 Synechocystis promoters. Measurements were from the middle of exponential phase, 4.5 hours into the experiment.
Figure 3. Stationary phase GFP expression relative to psaAB expression for 11 Synechocystis promoters. Measurements were from the middle of the stationary phase, 11 hours into the experiment.
Expression Results
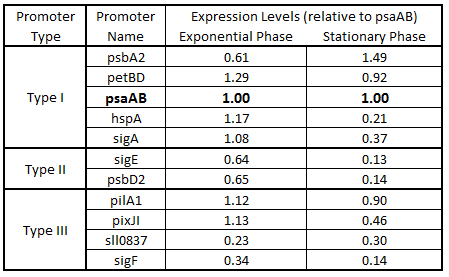
As expected from the high homology from promoter and RBS alignments (Tables 1 and 2, above), the Type I promoters possessed the highest level of GFP in both growth phases. Interestingly, expression levels of hspA and sigA were high during exponential phase and decreased significantly during stationary phase. Type II and Type III promoters exhibited moderate to low expression in both phases, likely due to the reduced homology with the consensus sequences. Despite low homology with the sigma70 promoter sequences, pilA1 exhibited high expression in both growth phases, and pixJI exhibited high expression in exponential phase. This could potentially be due to homology to other sigma factor binding sequences in E. coli, but these alignments have not yet been explored. The final expression levels are listed in Table 3 below for easier reference.
Table 3. Expression levels of 11 Synechocystis promoters in E. coli during exponential and stationary phase. Values are shown relative to psaAB expression levels.
Team Parts
<groupparts>iGEM010 Utah_State</groupparts>
 "
"

