Team:Groningen/13 September 2010
From 2010.igem.org
| (3 intermediate revisions not shown) | |||
| Line 81: | Line 81: | ||
<br> | <br> | ||
| - | [[Image: | + | [[Image:GrowthCurveGR5.jpg|400px]] |
<br> | <br> | ||
| Line 93: | Line 93: | ||
<br> | <br> | ||
| - | [[Image: | + | [[Image:THTGR5.jpg|400px]] |
<br> | <br> | ||
| Line 104: | Line 104: | ||
<br> | <br> | ||
| - | [[Image:SDS- | + | [[Image:SDS-PAGEGR5.jpg|400px]] |
<br> | <br> | ||
| Line 111: | Line 111: | ||
| + | '''Laura''' | ||
| + | Start working on gene expression matlab model, searched for suitable equations to describe the system. | ||
| + | |||
| + | '''Arend''' | ||
| + | Finalize information standard, start working on application of the standard | ||
{{Team:Groningen/Footer}} | {{Team:Groningen/Footer}} | ||
Latest revision as of 20:13, 25 October 2010
Week 27
Expression experiment - David & Peter
A broad experiment was set up: lysis/disrupted/differentconcentrationsubtilin/delta.
No positive results were found, a small sample size.
A experiment using anti-biotics as well, growth curves were interesting.
Chaplinj were added as a extra control.
Exression experiment
Peter & David
For this experiment, the following B. subtilis 168 strains were used:
All cultures were grown overnight at 37 degrees Celsius in a shaker room, the appropriate antibiotics were used at all points in time during this experiment.
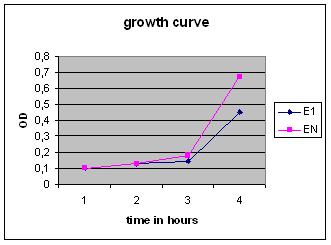
Overnight cultures were used to dilute to a B. subtilis culture of 0,1 OD, these strains were divided into ‘’induced’’ and ‘’non-induced’’. Induction with 0,5% subtilin was done at a OD of 0,5 (approximately 2,5 hours after growth of the 0,1 culture started).
After that the OD of the cultures was measured every .. hours.
Sample preperation
After .. hours, .. after induction, the samples were collected and processed. The following procedures were used:
Pellet preperation (PelletPrepGR)
Supernatant processing (SupernatantPrepGR)
Cell disruption (ExtractionCellWallsGR)
Lysozyme preperation (LysozymePrepGR)
Analysis was done using SDS-PAGE (SDS-PAGEGR) and THT staining (THTstainingGR).
Results:
Growth Curve
THT Staining
SDS-PAGE
Laura
Start working on gene expression matlab model, searched for suitable equations to describe the system.
Arend Finalize information standard, start working on application of the standard
 "
"


