Template:UNIPV-Pavia/Project/results/Self-cleaving affinity tags to easily purify proteins
From 2010.igem.org
(→Discussion) |
(→Phasins binding activity) |
||
| (23 intermediate revisions not shown) | |||
| Line 1: | Line 1: | ||
__NOTOC__ | __NOTOC__ | ||
==PHB production== | ==PHB production== | ||
| - | |||
| - | |||
| - | |||
| - | |||
| - | |||
| - | |||
| - | |||
| - | |||
| - | |||
| - | |||
===Methods=== | ===Methods=== | ||
| - | Preparation of samples for BioPlastic screening: | + | Preparation of samples for BioPlastic (PHB) screening: |
| - | * Cultures of | + | *Inoculum in LB+Amp of: |
| + | **<html><a href="http://www.dsmz.de/microorganisms/plasmid_info.php?dsmz_no=15372" target="_blank">DSMZ15372</a></html> ''E. coli'' strain | ||
| + | **<partinfo>BBa_B0032</partinfo> | ||
| + | *Cultures were left grow ON at +37°C, 220 rpm. | ||
| + | |||
| + | * Cultures of DSMZ15372 and <partinfo>BBa_B0032</partinfo> were diluted 1:100 in fresh LB+Amp and than prepared as follows: | ||
** <partinfo>BBa_B0032</partinfo> with NOTHING added (negative control) | ** <partinfo>BBa_B0032</partinfo> with NOTHING added (negative control) | ||
| - | ** | + | ** DSMZ15372 with NOTHING added |
| - | ** | + | ** DSMZ15372 + 2% glycerol (a carbon source for bioplastic production) |
| - | ** | + | ** DSMZ15372 + 1mM IPTG (inducer for lac promoter, expressing bioplastic enzymes) |
| - | ** | + | ** DSMZ15372 + 2% glycerol + 1mM IPTG |
| + | |||
| + | After 5 and 30 hours' growth, [[Team:UNIPV-Pavia/Material_Methods/Protocols#Sudan_Black_staining_protocol|Sudan Black staining protocol]] was performed on slides prepared for each culture. Slides were observed at the microscope. | ||
| - | |||
===Results=== | ===Results=== | ||
====5 hours'==== | ====5 hours'==== | ||
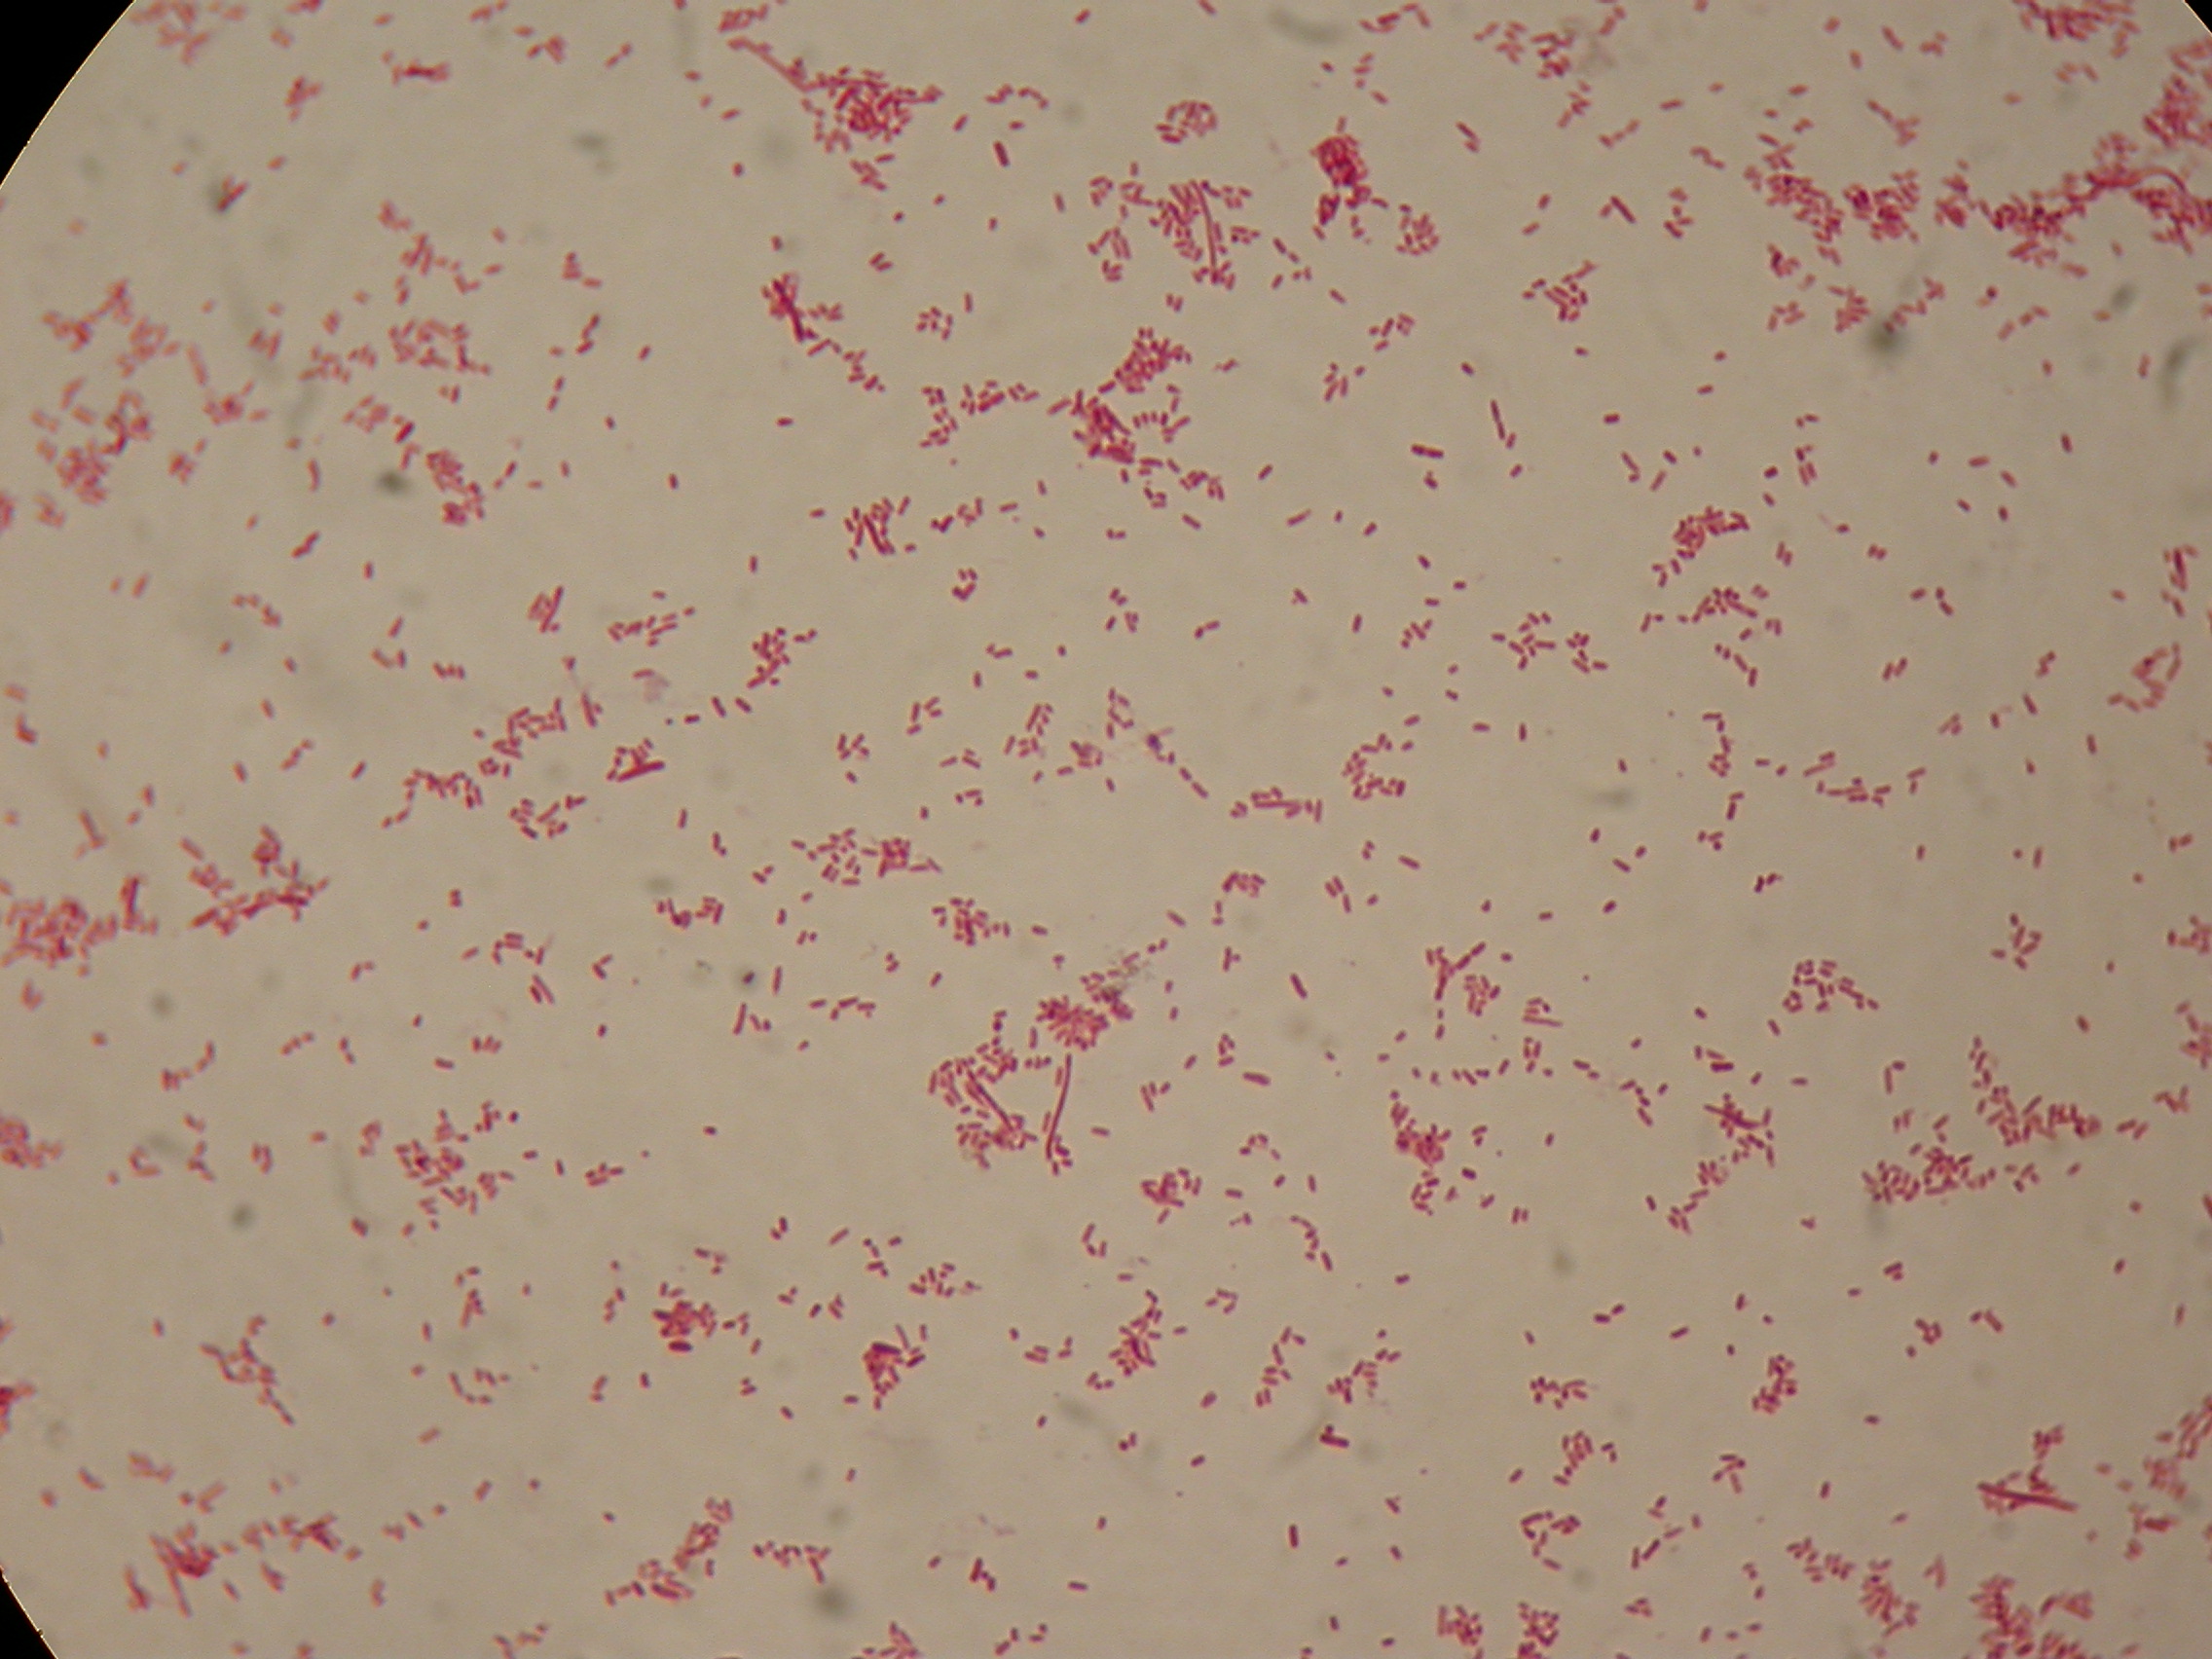
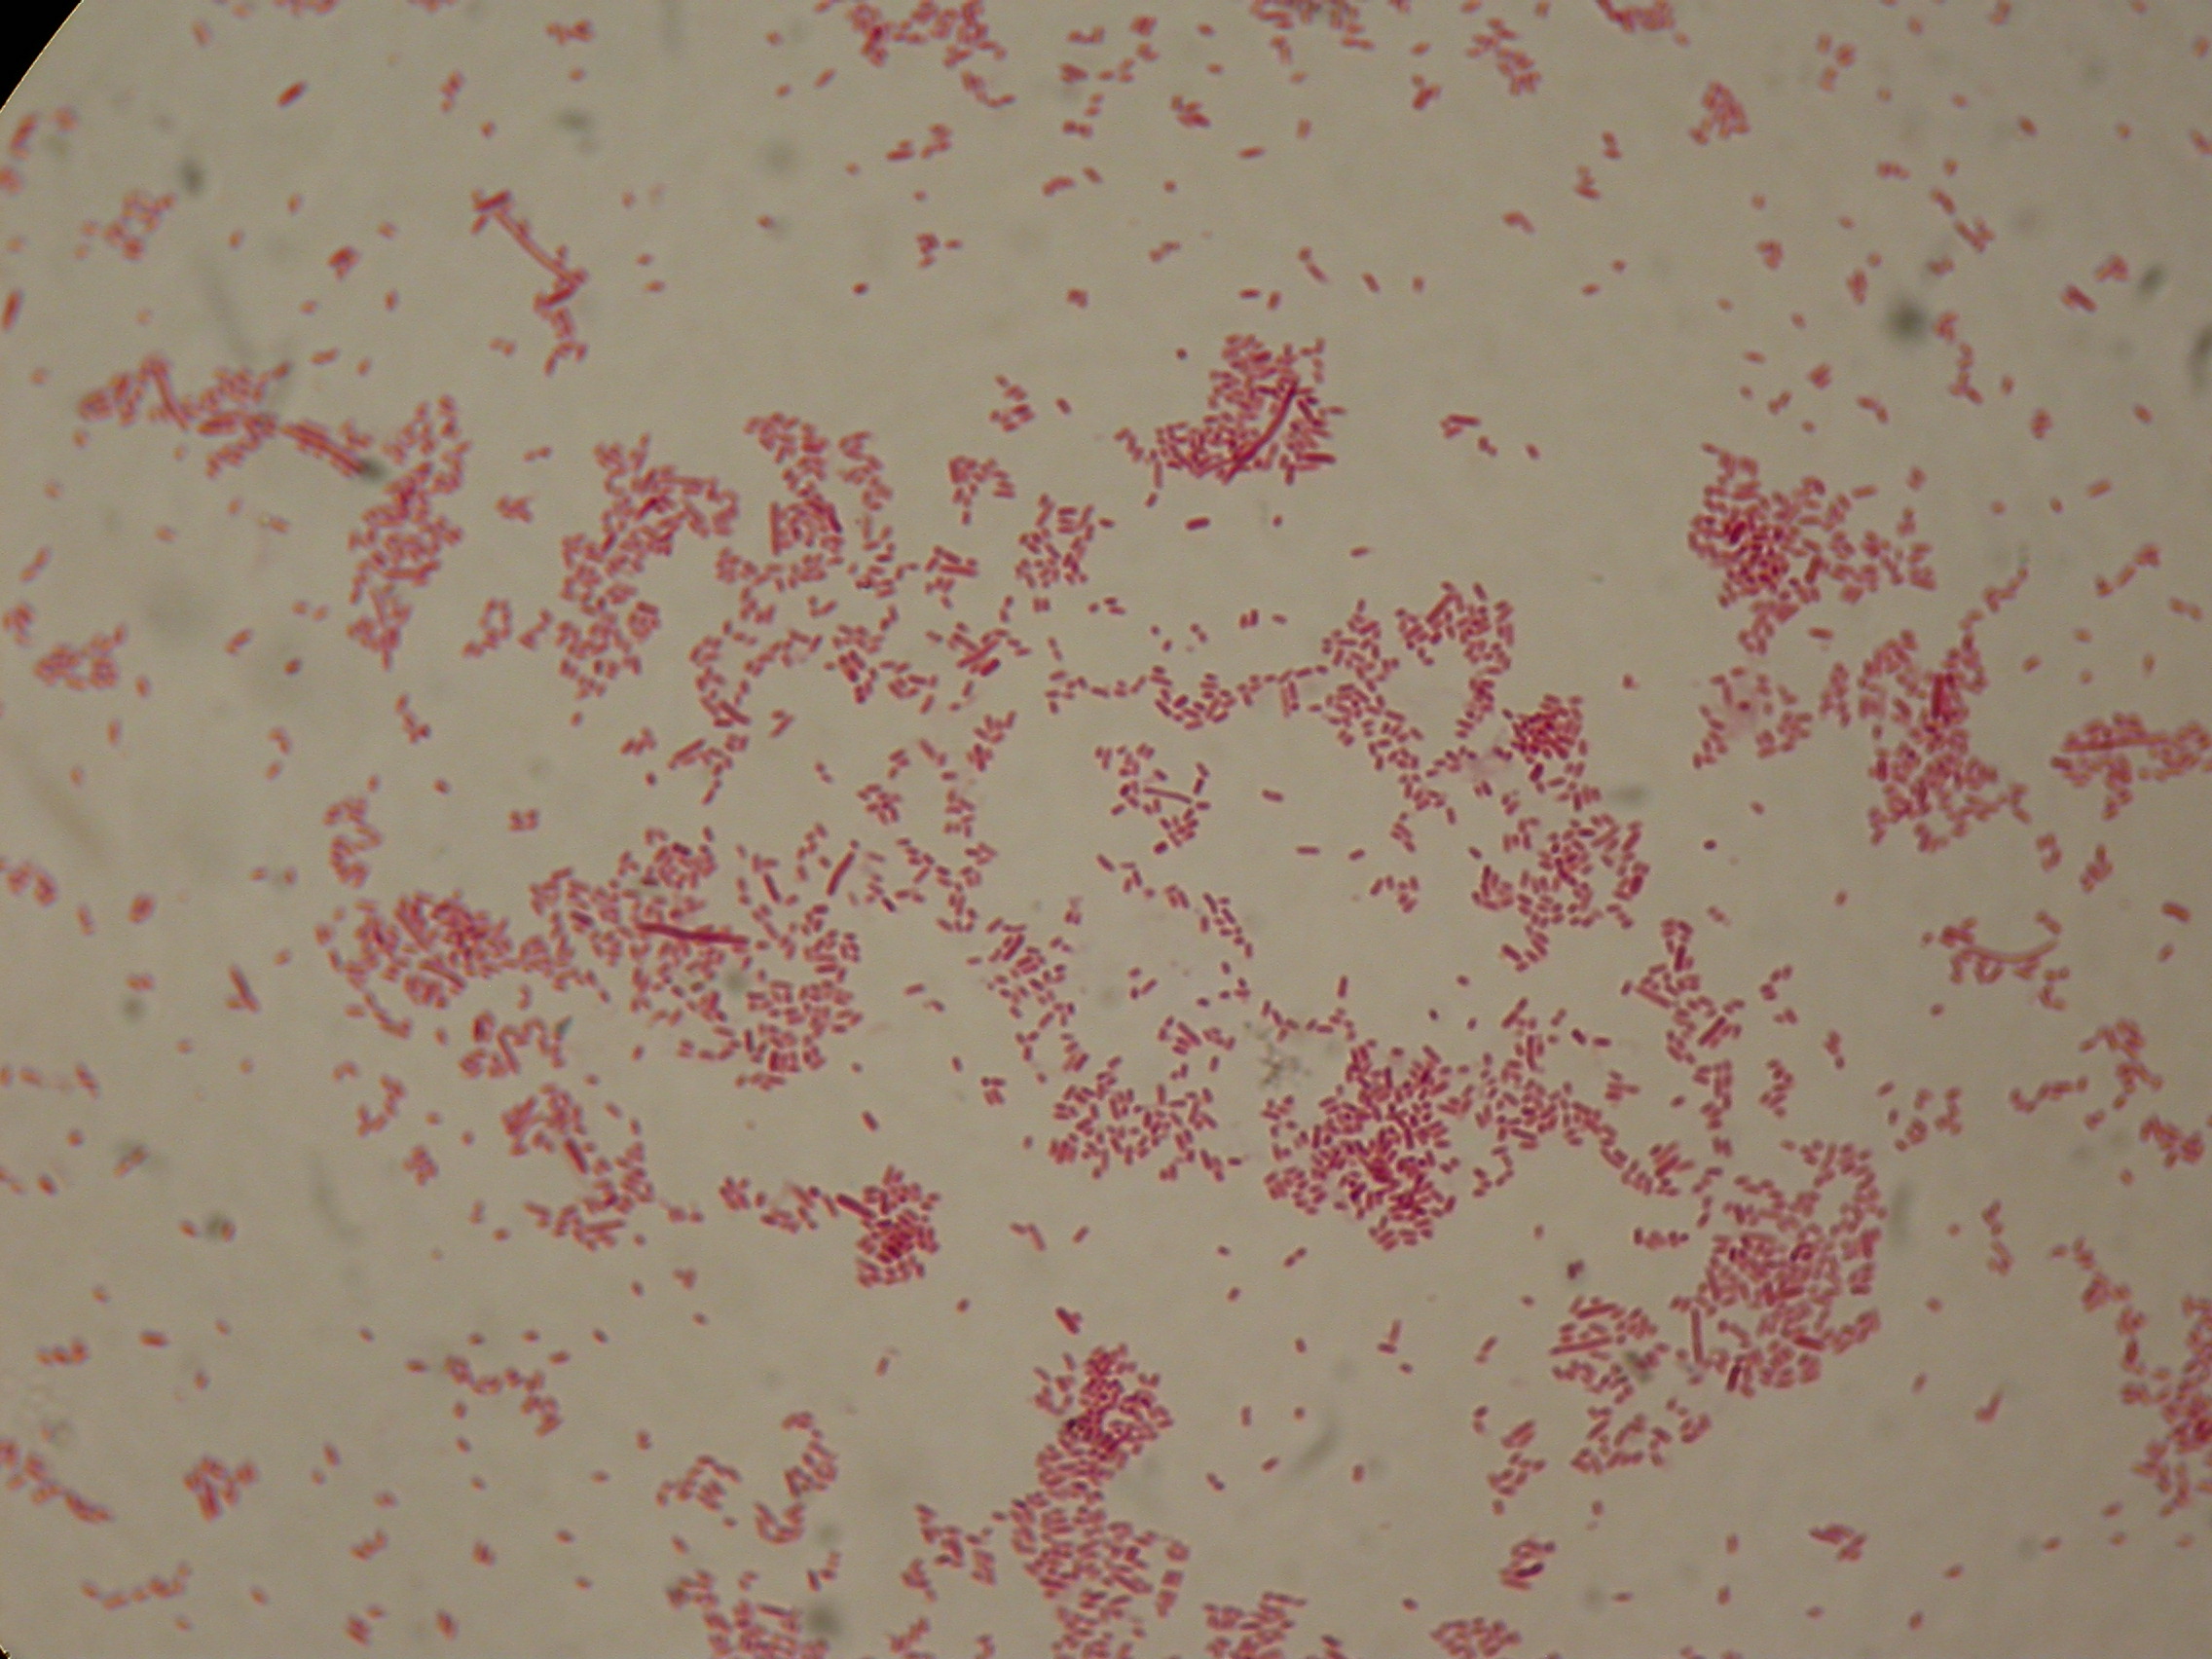
| - | [[Team:UNIPV-Pavia/Material_Methods/Protocols#Sudan_Black_staining_protocol|Sudan Black staining protocol]] was performed on 70ul | + | [[Team:UNIPV-Pavia/Material_Methods/Protocols#Sudan_Black_staining_protocol|Sudan Black staining protocol]] was performed on 70ul samples and 5 microscope slides were prepared. The resulting images are shown here: |
{|align="center" | {|align="center" | ||
| Line 31: | Line 27: | ||
|[[Image:UNIPV10_RBS32_nothing_5h.jpg|thumb|200px|center|<partinfo>BBa_B0032</partinfo> with nothing added in the culture, after 5 hours (negative control)]] || |[[Image:UNIPV10_RBS32_nothing_2_5h.jpg|thumb|200px|center|<partinfo>BBa_B0032</partinfo> with nothing added in the culture, after 5 hours (negative control)]] | |[[Image:UNIPV10_RBS32_nothing_5h.jpg|thumb|200px|center|<partinfo>BBa_B0032</partinfo> with nothing added in the culture, after 5 hours (negative control)]] || |[[Image:UNIPV10_RBS32_nothing_2_5h.jpg|thumb|200px|center|<partinfo>BBa_B0032</partinfo> with nothing added in the culture, after 5 hours (negative control)]] | ||
|- | |- | ||
| - | |[[Image:UNIPV10_PBHR68_nothing5h.jpg|thumb|200px|center| | + | |[[Image:UNIPV10_PBHR68_nothing5h.jpg|thumb|200px|center|DSMZ15372 with nothing added in the culture, after 5 hours]] || |[[Image:UNIPV10_PBHR68_nothing_2_5h.jpg|thumb|200px|center|DSMZ15372 with nothing added in the culture, after 5 hours]] |
|- | |- | ||
| - | |[[Image:UNIPV10_PBHR68_gly_5h.jpg|thumb|200px|center| | + | |[[Image:UNIPV10_PBHR68_gly_5h.jpg|thumb|200px|center|DSMZ15372 with 2% glycerol added in the culture, after 5 hours]] || |[[Image:UNIPV10_PBHR68_gly_2_5h.jpg|thumb|200px|center|DSMZ15372 with 2% glycerol added in the culture, after 5 hours]] |
|- | |- | ||
| - | |[[Image:UNIPV10_PBHR68_IPTG_5h.jpg|thumb|200px|center| | + | |[[Image:UNIPV10_PBHR68_IPTG_5h.jpg|thumb|200px|center|DSMZ15372 with 1mM IPTG added in the culture, after 5 hours]] || |[[Image:UNIPV10_PBHR68_IPTG_2_5h.jpg|thumb|200px|center|DSMZ15372 with 1mM IPTG in the culture, after 5 hours]] |
|- | |- | ||
| - | |[[Image:UNIPV10_PBHR68_gly_IPTG_5h.jpg|thumb|200px|center| | + | |[[Image:UNIPV10_PBHR68_gly_IPTG_5h.jpg|thumb|200px|center|DSMZ15372 with 1mM IPTG and 2% glycerol added in the culture, after 5 hours]] || |[[Image:UNIPV10_PBHR68_gly_IPTG_2_5h.jpg|thumb|200px|center|DSMZ15372 with 1mM IPTG and 2% glycerol added in the culture, after 5 hours]] |
|} | |} | ||
| Line 43: | Line 39: | ||
====30 hours'==== | ====30 hours'==== | ||
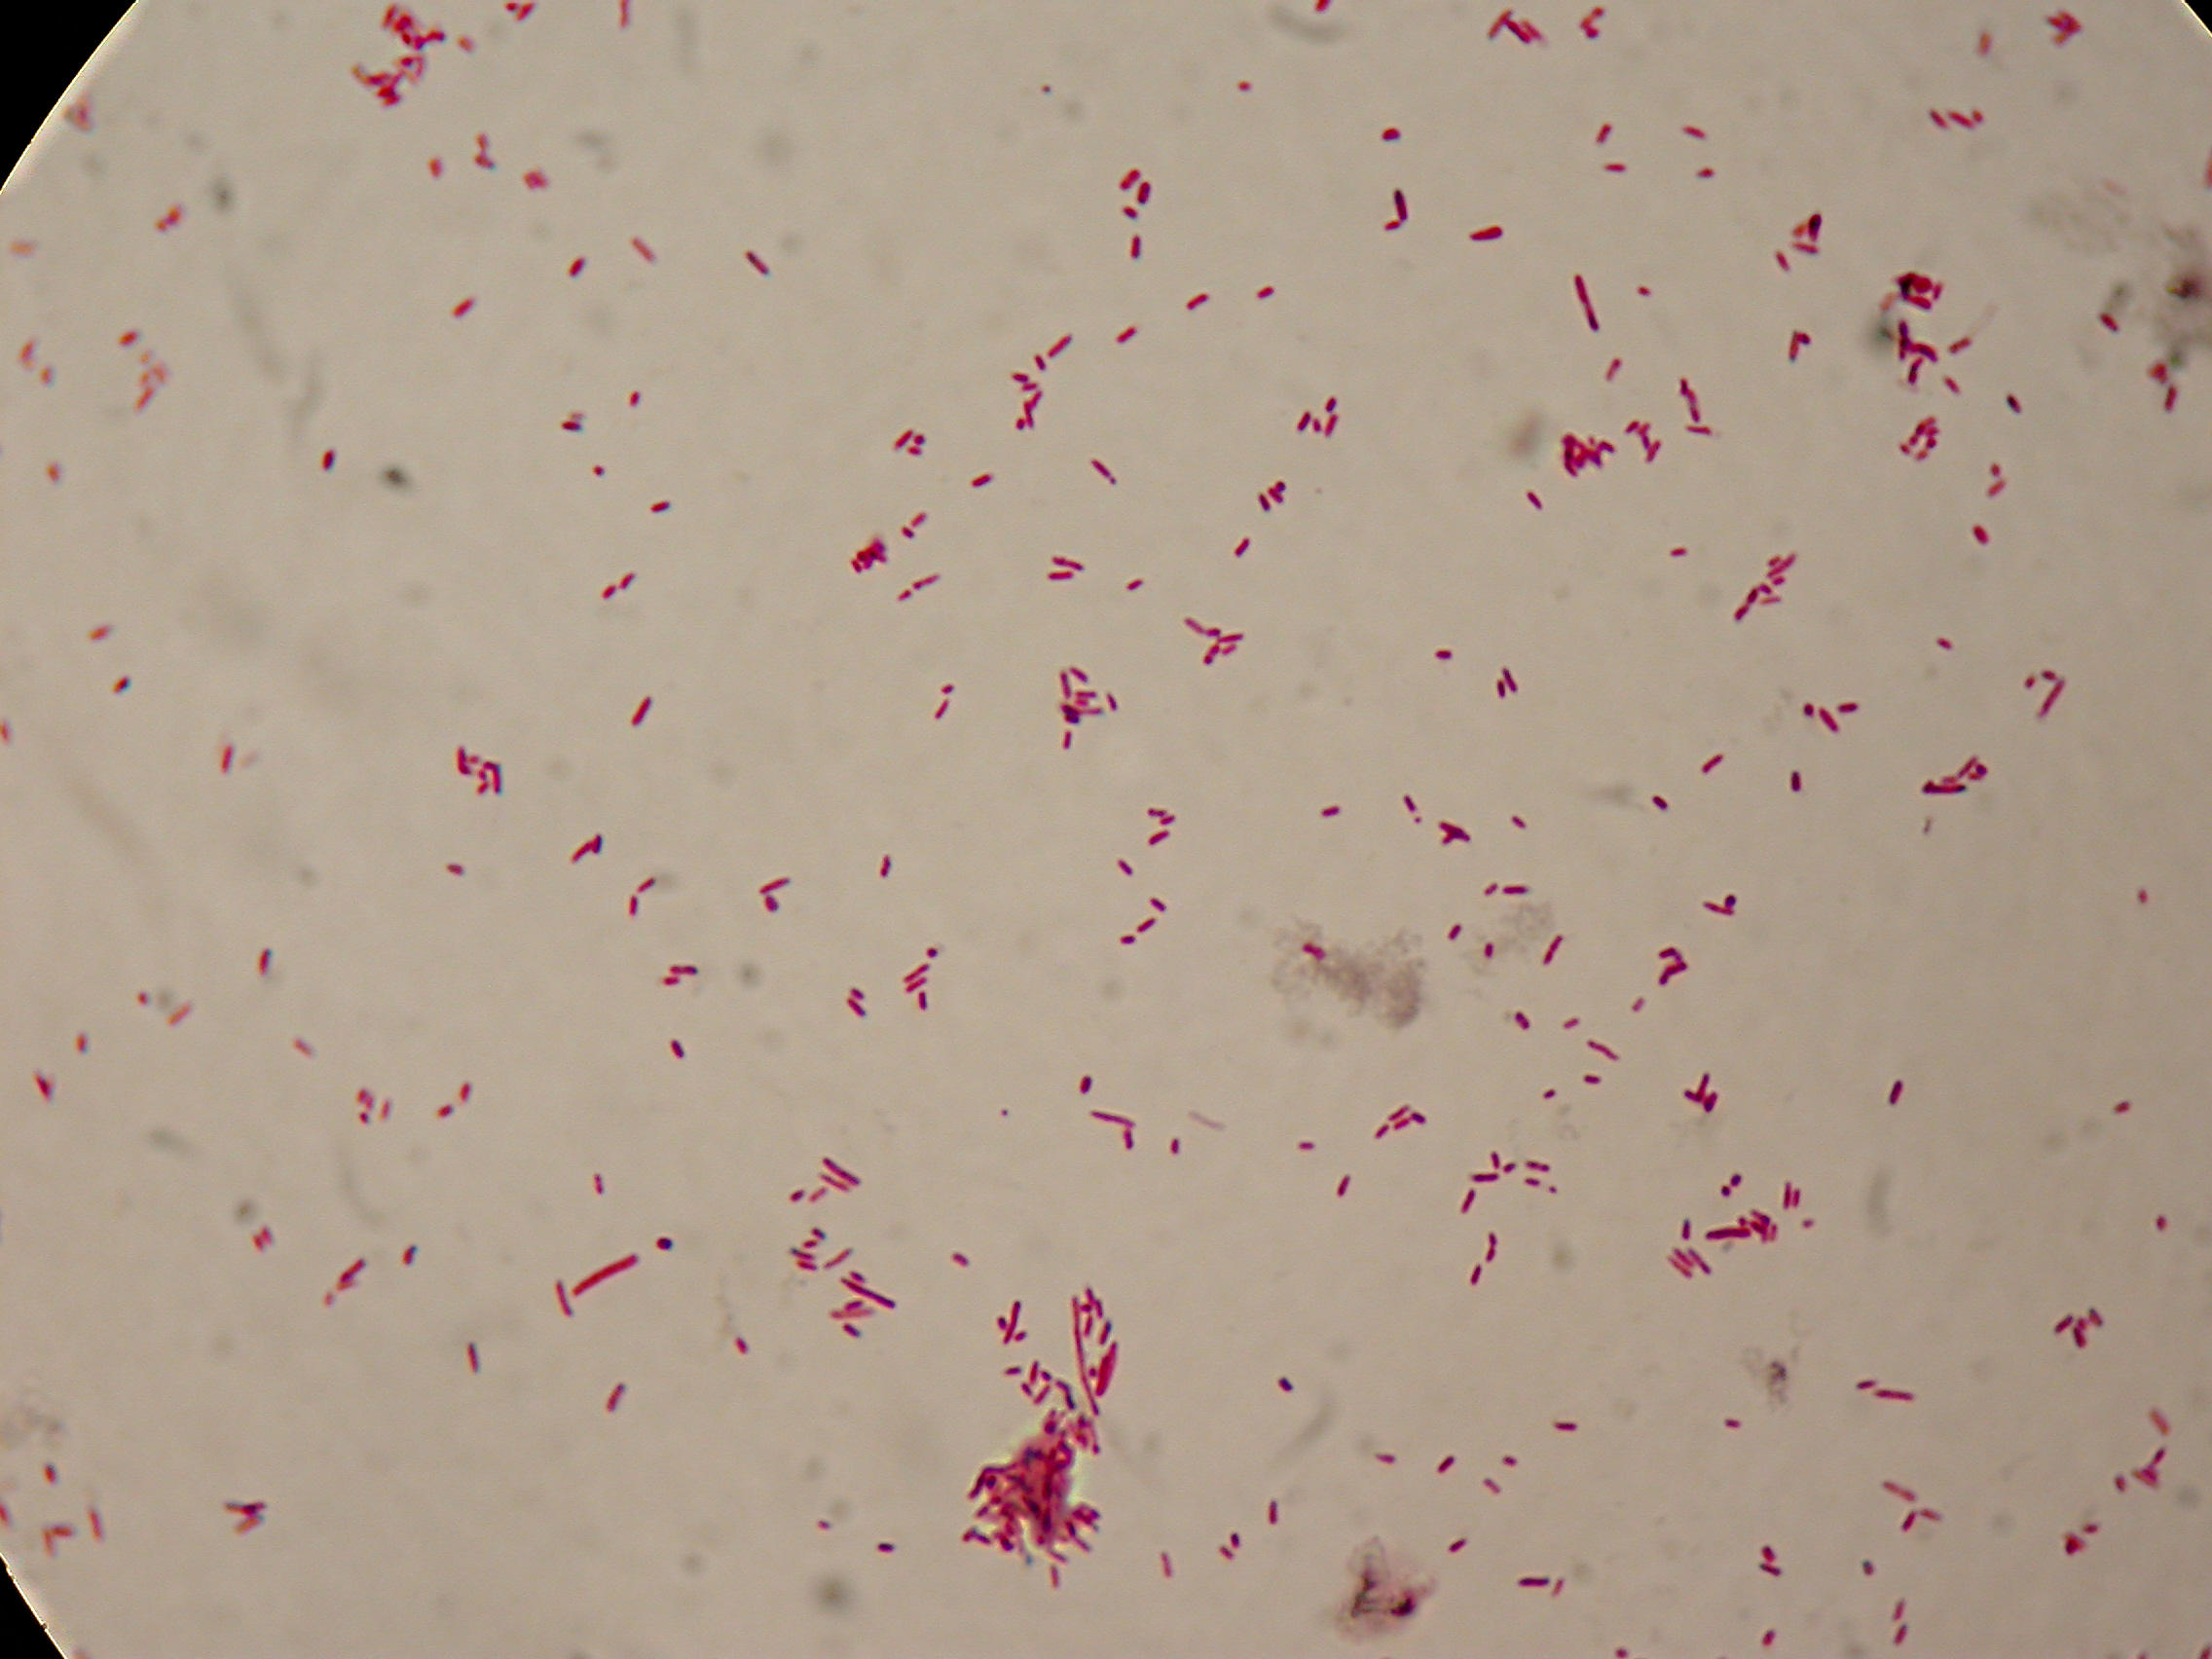
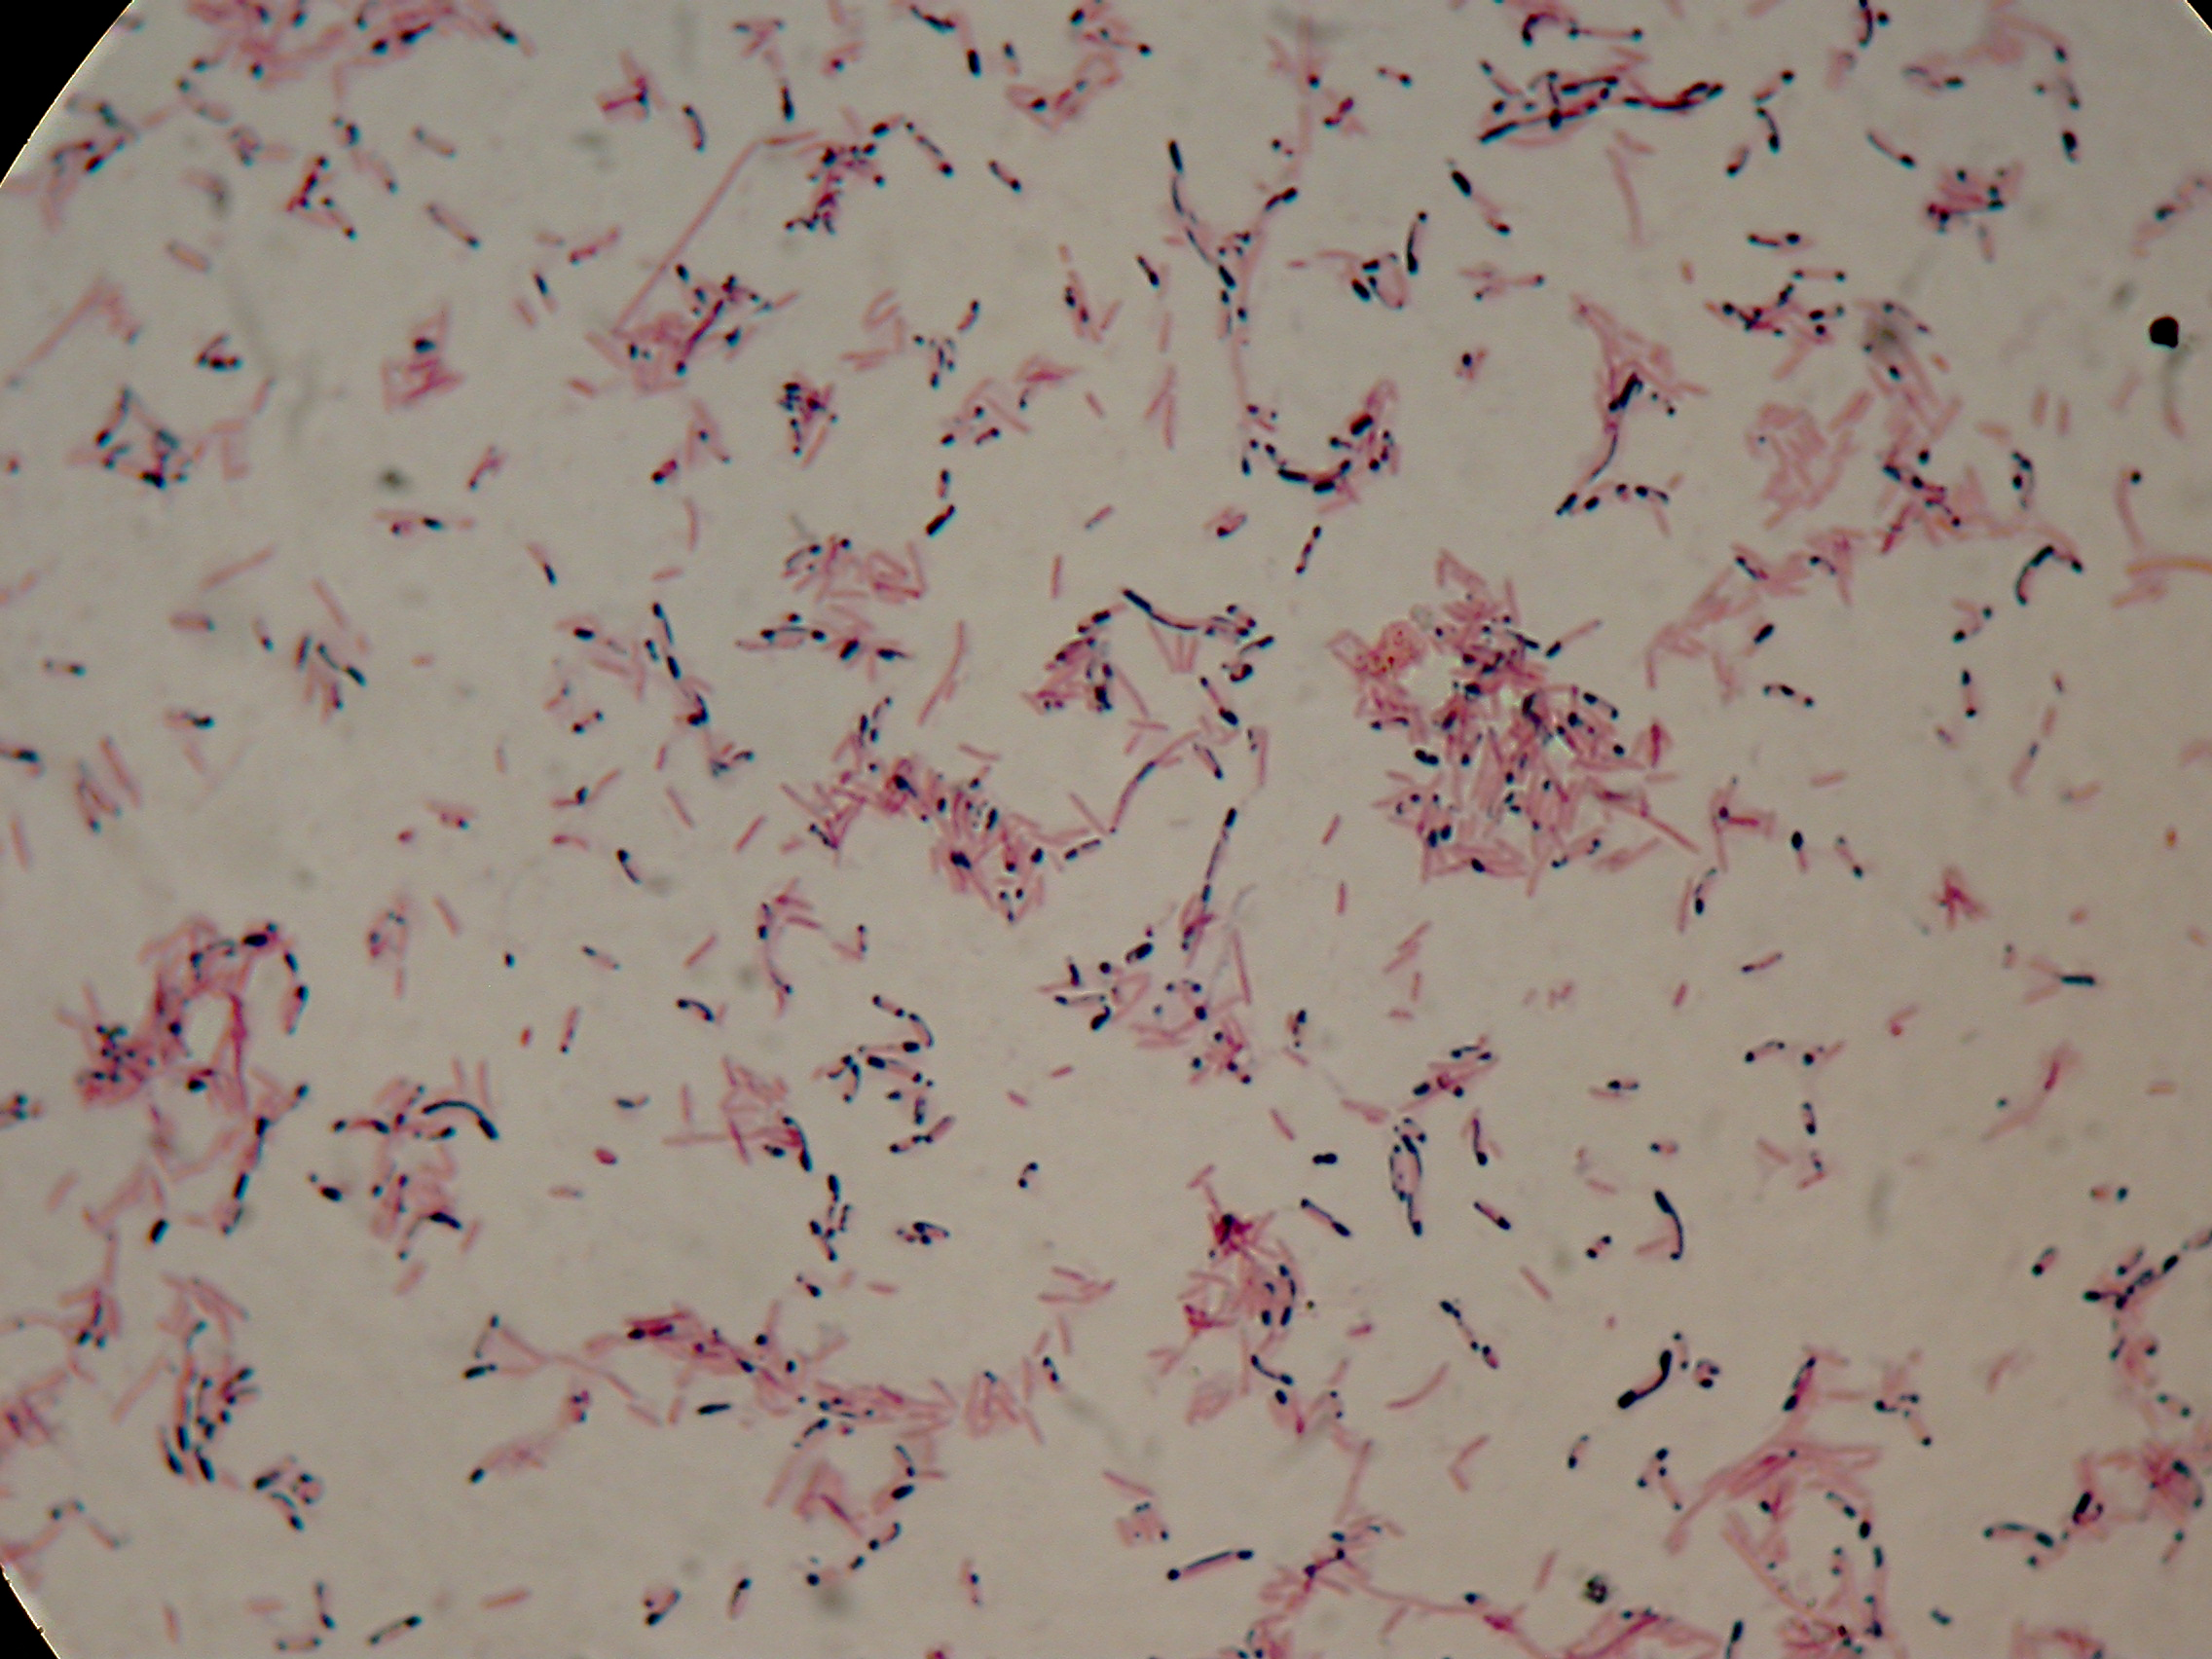
| - | [[Team:UNIPV-Pavia/Material_Methods/Protocols#Sudan_Black_staining_protocol|Sudan Black staining protocol]] was performed on 70ul | + | [[Team:UNIPV-Pavia/Material_Methods/Protocols#Sudan_Black_staining_protocol|Sudan Black staining protocol]] was performed on 70ul samples and 5 microscope slides were prepared. The resulting images are shown here: |
{|align="center" | {|align="center" | ||
| Line 49: | Line 45: | ||
|[[Image:UNIPV10_RBS32_nothing_30h.jpg|thumb|200px|center|<partinfo>BBa_B0032</partinfo> with nothing added in the culture, after 30 hours (negative control)]] || |[[Image:UNIPV10_RBS32_nothing_2_30h.jpg|thumb|200px|center|<partinfo>BBa_B0032</partinfo> with nothing added in the culture, after 30 hours (negative control)]] | |[[Image:UNIPV10_RBS32_nothing_30h.jpg|thumb|200px|center|<partinfo>BBa_B0032</partinfo> with nothing added in the culture, after 30 hours (negative control)]] || |[[Image:UNIPV10_RBS32_nothing_2_30h.jpg|thumb|200px|center|<partinfo>BBa_B0032</partinfo> with nothing added in the culture, after 30 hours (negative control)]] | ||
|- | |- | ||
| - | |[[Image:UNIPV10_PBHR68_nothing_30h.jpg|thumb|200px|center| | + | |[[Image:UNIPV10_PBHR68_nothing_30h.jpg|thumb|200px|center|DSMZ15372 with nothing added in the culture, after 30 hours]] || |[[Image:UNIPV10_PBHR68_nothing_2_30h.jpg|thumb|200px|center|DSMZ15372 with nothing added in the culture, after 30 hours]] |
|- | |- | ||
| - | |[[Image:UNIPV10_PBHR68_gly_30h.jpg|thumb|200px|center| | + | |[[Image:UNIPV10_PBHR68_gly_30h.jpg|thumb|200px|center|DSMZ15372 with 2% glycerol added in the culture, after 30 hours]] || |[[Image:UNIPV10_PBHR68_gly_2_30h.jpg|thumb|200px|center|DSMZ15372 with 2% glycerol added in the culture, after 30 hours]] |
|- | |- | ||
| - | |[[Image:UNIPV10_PBHR68_IPTG_30h.jpg|thumb|200px|center| | + | |[[Image:UNIPV10_PBHR68_IPTG_30h.jpg|thumb|200px|center|DSMZ15372 with 1mM IPTG added in the culture, after 30 hours]] || |[[Image:UNIPV10_PBHR68_IPTG_2_30h.jpg|thumb|200px|center|DSMZ15372 with 1mM IPTG in the culture, after 30 hours]] |
|- | |- | ||
| - | |[[Image:UNIPV10_PBHR68_gly_IPTG_30h.jpg|thumb|200px|center| | + | |[[Image:UNIPV10_PBHR68_gly_IPTG_30h.jpg|thumb|200px|center|DSMZ15372 with 1mM IPTG and 2% glycerol added in the culture, after 30 hours]] || |[[Image:UNIPV10_PBHR68_gly_IPTG_2_30h.jpg|thumb|200px|center|DSMZ15372 with 1mM IPTG and 2% glycerol added in the culture, after 30 hours]] |
|} | |} | ||
===Discussion=== | ===Discussion=== | ||
| - | In images it | + | In the above images it is clearly possible to see that after <b>5 hours</b> DSMZ15372 without any kind of addition is completely similar to negative control <partinfo>BBa_B0032</partinfo> and there is no trace of bioplastic granules production. In DSMZ15372 in which IPTG or glycerol were added to the media, it is possible to see very small dark spots that could be identified as PHB granules in a few bacteria. In samples with both IPTG and glycerol, bioplastic granules are clearly visible in many cells. |
| - | + | As expected after <b>30 hours</b> negative control <partinfo>BBa_B0032</partinfo> does not show any trace of granules, while DSMZ15372 shows bioplastic granules in each experimental condition. This demonstrates that PHB can be produced without the presence of both IPTG and glycerol. | |
| - | ==Fusion protein | + | In conclusion, we validated the right culture conditions for PHB production using an existing engineered strain. This enables the implementation of the purification system designed in this project. Future work can explore the possibility of producing and optimizing the PHB production with BioBrick standard parts. |
| - | + | ||
| + | ==Fusion protein validation== | ||
| + | The newly designed and constructed affinity tags <partinfo>BBa_K300002</partinfo>, <partinfo>BBa_K300093</partinfo>, <partinfo>BBa_K300094</partinfo>, <partinfo>BBa_K300097</partinfo> were assembled to a constitutive or inducible promoter with RBS upstream and to a Silver fusion-compatible GFP coding sequence with terminator (<partinfo>BBa_K300005</partinfo>). The resulting measurement parts were assayed to validate the bacterial growth and GFP synthesis rate of the following constructs in order to verify the right protein folding. | ||
===Costitutive promoter devices=== | ===Costitutive promoter devices=== | ||
| Line 74: | Line 72: | ||
*<partinfo>BBa_K300090</partinfo> | *<partinfo>BBa_K300090</partinfo> | ||
*<partinfo>BBa_K300099</partinfo> | *<partinfo>BBa_K300099</partinfo> | ||
| - | *<partinfo>BBa_K173000</partinfo> (positive control) | + | *<partinfo>BBa_K173000</partinfo> (positive control, J23100 constitutive promoter expressing GFP) |
| - | *<partinfo>BBa_B0031</partinfo> (negative control) | + | *<partinfo>BBa_B0031</partinfo> (negative control, a non-fluorescent culture) |
| - | + | Cultures were grown ON at 37°C, 220 rpm. | |
| - | The following day cultures were diluted 1:100 and let grow again for about five hours at | + | The following day cultures were diluted 1:100 and let grow again for about five hours at 37°C, 220 rpm. |
| - | + | The optical density (O.D.) of each culture was than measured with TECAN Infinte F200. Samples were diluted in order to obtain the same O.D. equal to 0.02. | |
| + | |||
| + | Then we performed a 21-hour experiment with measurements of absorbance and green fluorescence every five minutes with TECAN Infinite F200; cultures were shaken for 15 seconds every five minutes. Acquired data were blanked by subtracting the media absorbance (for absorbance measurements) and the <partinfo>BBa_B0031</partinfo> fluorescence (for fluorescence measurements). Then, the relative GFP synthesis rate per cell was evaluated by computing (1/O.D.600)*dGFP/dt, where O.D.600 is the blanked absorbance of the culture of interest and GFP is its blanked fluorescence. | ||
| + | Each value shown below is the mean of three measurements in exponential phase and error bars represent the 95% confidence interval of the mean. | ||
| - | |||
====Results==== | ====Results==== | ||
<div align="center"> | <div align="center"> | ||
| Line 93: | Line 93: | ||
<table> | <table> | ||
<tr> | <tr> | ||
| - | <td>[[Image:UNIPV10_pTET_c_BAR.png|thumb|300px|Mean (dGFP/dt)/O.D. over the exponential phase (under the hypothesis that GFP half-life in fusion contructs is similar to the original one - <partinfo>BBa_E0040</partinfo>)]]</td> | + | <td>[[Image:UNIPV10_pTET_c_BAR.png|thumb|300px|Mean (dGFP/dt)/O.D. over the exponential phase (under the hypothesis that GFP half-life in fusion contructs is similar to the original one -<partinfo>BBa_E0040</partinfo>)]]</td> |
</tr> | </tr> | ||
</table> | </table> | ||
| Line 99: | Line 99: | ||
<table border="1"> | <table border="1"> | ||
<tr align="center"> | <tr align="center"> | ||
| - | <th>Culture</th><th>Doubling time [min.]</th> | + | <th>Culture</th><th>Doubling time [min.] ± std error</th> |
</tr> | </tr> | ||
<tr align="center"> | <tr align="center"> | ||
| - | <td><partinfo>BBa_K173000</partinfo></td><td> | + | <td><partinfo>BBa_K173000</partinfo></td><td>76.3336 ± 1.4362</td> |
</tr> | </tr> | ||
<tr align="center"> | <tr align="center"> | ||
| - | <td><partinfo>BBa_K300086</partinfo></td><td> | + | <td><partinfo>BBa_K300086</partinfo></td><td>73.6685 ± 1.6245</td> |
</tr> | </tr> | ||
<tr align="center"> | <tr align="center"> | ||
| - | <td><partinfo>BBa_K300088</partinfo></td><td> | + | <td><partinfo>BBa_K300088</partinfo></td><td>74.8806 ± 2.7699</td> |
</tr> | </tr> | ||
<tr align="center"> | <tr align="center"> | ||
| - | <td><partinfo>BBa_K300090</partinfo></td><td> | + | <td><partinfo>BBa_K300090</partinfo></td><td>75.9433 ± 3.6808</td> |
</tr> | </tr> | ||
<tr align="center"> | <tr align="center"> | ||
| - | <td><partinfo>BBa_K300099</partinfo></td><td> | + | <td><partinfo>BBa_K300099</partinfo></td><td>78.4634 ± 2.5622</td> |
</tr> | </tr> | ||
<tr align="center"> | <tr align="center"> | ||
| - | <td><partinfo>BBa_B0031</partinfo></td><td> | + | <td><partinfo>BBa_B0031</partinfo></td><td>70.8421 ± 2.2181</td> |
</tr> | </tr> | ||
</table> | </table> | ||
| Line 123: | Line 123: | ||
====Discussion==== | ====Discussion==== | ||
| - | All | + | All the cultures showed a similar growth curve; doubling time was computed as described [https://2010.igem.org/Team:UNIPV-Pavia/Parts/Characterization#Doubling_time_evaluation here] in order to obtain information about the metabolic burden due to the synthesis of the studied fusion proteins. It is possible to see that all doubling times are comparable; it is possible to assert that the expression of these BioBrick parts doesn't cause abnormal stress to the cells. |
| - | + | From GFP curve it is possible to appreciate that in <partinfo>BBa_K300086</partinfo>, <partinfo>BBa_K300088</partinfo>, <partinfo>BBa_K300090</partinfo>, <partinfo>BBa_K300099</partinfo> GFP accumulation is very similar and it is significantly different from the one of the negative control <partinfo>BBa_B0031</partinfo>. These results show that the green fluorescent protein assembled downstream of the genetic circuit is correctly folded. | |
| + | |||
| + | The mean protein synthesis rate was also computed over the exponential growth phase, showing again an appreciable GFP production rate that is about half of the positive control GFP. | ||
| - | |||
---- | ---- | ||
===3OC6HSL inducible devices=== | ===3OC6HSL inducible devices=== | ||
| - | |||
====Methods==== | ====Methods==== | ||
Inoculum (into 5 ml LB+Amp) from glycerol stock of: | Inoculum (into 5 ml LB+Amp) from glycerol stock of: | ||
| Line 139: | Line 139: | ||
*<partinfo>BBa_K173000</partinfo> (positive control) | *<partinfo>BBa_K173000</partinfo> (positive control) | ||
*<partinfo>BBa_B0031</partinfo> (negative control) | *<partinfo>BBa_B0031</partinfo> (negative control) | ||
| - | + | Cultures were grown ON at 37°C, 220 rpm. | |
| - | The following day cultures were diluted 1:100 and let grow again for about five hours at | + | The following day cultures were diluted 1:100 and let grow again for about five hours at 37°C, 220 rpm. |
| - | + | The optical density (O.D.) of each culture was than measured with TECAN Infinte F200. Samples were diluted in order to obtain the same O.D. equal to 0.02. | |
| - | + | Then we performed a 21-hour experiment with measurements of absorbance and green fluorescence every five minutes using TECAN Infinite F200; cultures were shaken for 15 seconds every five minutes. <partinfo>BBa_K300091</partinfo> and <partinfo>BBa_K300092</partinfo> constructs were induced with 100nM of HSL directly in the 96-well microplate. Acquired data were blanked by subtracting the media absorbance (for absorbance measurements) and the <partinfo>BBa_B0031</partinfo> fluorescence (for fluorescence measurements). Then, the relative GFP synthesis rate per cell was evaluated by computing (1/O.D.600)*dGFP/dt, where O.D.600 is the blanked absorbance of the culture of interest and GFP is its blanked fluorescence. | |
| + | Each value shown below is the mean of three measurements in exponential phase and error bars represent the 95% confidence interval of the mean. | ||
====Results==== | ====Results==== | ||
| Line 157: | Line 158: | ||
<table> | <table> | ||
<tr> | <tr> | ||
| - | <td>[[Image:UNIPV10_HSL_c_BAR.png|thumb|300px|Mean (dGFP/dt)/O.D. over the exponential phase (under the hypothesis that GFP half-life in fusion contructs is similar to the original one - <partinfo>BBa_E0040</partinfo>)]]</td> | + | <td>[[Image:UNIPV10_HSL_c_BAR.png|thumb|300px|Mean (dGFP/dt)/O.D. over the exponential phase (under the hypothesis that GFP half-life in fusion contructs is similar to the original one -<partinfo>BBa_E0040</partinfo>)]]</td> |
</tr> | </tr> | ||
</table> | </table> | ||
| Line 163: | Line 164: | ||
<table border="1"> | <table border="1"> | ||
<tr align="center"> | <tr align="center"> | ||
| - | <th>Culture</th><th>Doubling time [min.]</th> | + | <th>Culture</th><th>Doubling time [min.] ± std error</th> |
</tr> | </tr> | ||
<tr align="center"> | <tr align="center"> | ||
| - | <td><partinfo>BBa_K173000</partinfo></td><td> | + | <td><partinfo>BBa_K173000</partinfo></td><td>76.3336 ± 1.4362</td> |
</tr> | </tr> | ||
<tr align="center"> | <tr align="center"> | ||
| - | <td><partinfo>BBa_K300091</partinfo><br/>induced</td><td>121</td> | + | <td><partinfo>BBa_K300091</partinfo><br/>induced</td><td>121.1434 ± 7.0275</td> |
</tr> | </tr> | ||
<tr align="center"> | <tr align="center"> | ||
| - | <td><partinfo>BBa_K300091</partinfo><br/>not induced</td><td>74</td> | + | <td><partinfo>BBa_K300091</partinfo><br/>not induced</td><td>74.4267 ± 1.3696</td> |
</tr> | </tr> | ||
<tr align="center"> | <tr align="center"> | ||
| - | <td><partinfo>BBa_K300092</partinfo><br/>induced</td><td> | + | <td><partinfo>BBa_K300092</partinfo><br/>induced</td><td>122.6088 ± 1.2785</td> |
</tr> | </tr> | ||
<tr align="center"> | <tr align="center"> | ||
| - | <td><partinfo>BBa_K300092</partinfo><br/>not induced</td><td> | + | <td><partinfo>BBa_K300092</partinfo><br/>not induced</td><td>71.5105 ± 2.7113</td> |
</tr> | </tr> | ||
<tr align="center"> | <tr align="center"> | ||
| - | <td><partinfo>BBa_B0031</partinfo></td><td> | + | <td><partinfo>BBa_B0031</partinfo></td><td>70.8421 ± 2.2181</td> |
</tr> | </tr> | ||
</table> | </table> | ||
| Line 187: | Line 188: | ||
====Discussion==== | ====Discussion==== | ||
| - | All | + | All the cultures showed a similar growth curve; doubling time was computed as described [https://2010.igem.org/Team:UNIPV-Pavia/Parts/Characterization#Doubling_time_evaluation here] in order to obtain information about the burden due to the synthesis of such fusion proteins. It is possible to see that all doubling times are very similar except for induced cultures. In this case doubling time is much higher than both positive control and non-induced cultures; for this reason it is possible to assert that induction gives a high metabolic burden. |
| + | |||
| + | From GFP curve and mean protein synthesis rate it is possible to appreciate that induced <partinfo>BBa_K300091</partinfo> and <partinfo>BBa_K300092</partinfo> GFP accumulation profiles are comparable and they significantly differ from the GFP raw time series of the negative control <partinfo>BBa_B0031</partinfo>. On the other hand not induced <partinfo>BBa_K300091</partinfo> and <partinfo>BBa_K300092</partinfo> show a profile that is very similar to the negative control. These results show that the green fluorescent protein assembled downstream of the construct is correctly folded and that the inducible system works as expected. | ||
| + | |||
| + | Not induced <partinfo>BBa_K300091</partinfo> and <partinfo>BBa_K300092</partinfo> show a low GFP synthesis rate maybe due to 3OC6HSL inducible circuit leakage activity. | ||
| - | + | ==Submitted fusion bricks for self-cleaving affinity tag construction== | |
| + | The results shown above have demonstrated that the right folding can occur in a proof of concept fusion protein assembled with the newly designed synthetic affinity tags. However, the Phasin affinity with PHB granules and the self-cleavage behaviour of the Intein have not been tested yet. | ||
| - | + | Several BioBrick basic and composite parts have been submitted to the Registry to enable the construction of the desired composite affinity tags for protein purification using PHB. All these parts are compatible with the Silver fusion assembly to allow in-frame protein coding sequence assembly. A list of the designed and submitted affinity tags or self-cleavable affinity tags is reported below: | |
| + | *<partinfo>BBa_K300002</partinfo> (DNA Sent) | ||
| + | *<partinfo>BBa_K300003</partinfo> (DNA Sent) | ||
| + | *<partinfo>BBa_K300004</partinfo> (DNA Sent) | ||
| + | *<partinfo>BBa_K300079</partinfo> (DNA Sent) | ||
| + | *<partinfo>BBa_K300080</partinfo> (DNA Sent) | ||
| + | *<partinfo>BBa_K300081</partinfo> (DNA Sent) | ||
| + | *<partinfo>BBa_K300083</partinfo> (DNA Sent) | ||
| + | *<partinfo>BBa_K300084</partinfo> (DNA Sent) | ||
| + | *<partinfo>BBa_K300093</partinfo> | ||
| + | *<partinfo>BBa_K300094</partinfo> | ||
| + | *<partinfo>BBa_K300095</partinfo> | ||
| + | *<partinfo>BBa_K300097</partinfo> | ||
| - | + | Registry users are welcome to use them to create and optimize protein purification through the binding of the target protein to PHB granules, thus engineering a simple and cheap purification system. | |
Latest revision as of 00:35, 28 October 2010
PHB production
Methods
Preparation of samples for BioPlastic (PHB) screening:
- Inoculum in LB+Amp of:
- DSMZ15372 E. coli strain
- <partinfo>BBa_B0032</partinfo>
- Cultures were left grow ON at +37°C, 220 rpm.
- Cultures of DSMZ15372 and <partinfo>BBa_B0032</partinfo> were diluted 1:100 in fresh LB+Amp and than prepared as follows:
- <partinfo>BBa_B0032</partinfo> with NOTHING added (negative control)
- DSMZ15372 with NOTHING added
- DSMZ15372 + 2% glycerol (a carbon source for bioplastic production)
- DSMZ15372 + 1mM IPTG (inducer for lac promoter, expressing bioplastic enzymes)
- DSMZ15372 + 2% glycerol + 1mM IPTG
After 5 and 30 hours' growth, Sudan Black staining protocol was performed on slides prepared for each culture. Slides were observed at the microscope.
Results
5 hours'
Sudan Black staining protocol was performed on 70ul samples and 5 microscope slides were prepared. The resulting images are shown here:
30 hours'
Sudan Black staining protocol was performed on 70ul samples and 5 microscope slides were prepared. The resulting images are shown here:
Discussion
In the above images it is clearly possible to see that after 5 hours DSMZ15372 without any kind of addition is completely similar to negative control <partinfo>BBa_B0032</partinfo> and there is no trace of bioplastic granules production. In DSMZ15372 in which IPTG or glycerol were added to the media, it is possible to see very small dark spots that could be identified as PHB granules in a few bacteria. In samples with both IPTG and glycerol, bioplastic granules are clearly visible in many cells.
As expected after 30 hours negative control <partinfo>BBa_B0032</partinfo> does not show any trace of granules, while DSMZ15372 shows bioplastic granules in each experimental condition. This demonstrates that PHB can be produced without the presence of both IPTG and glycerol.
In conclusion, we validated the right culture conditions for PHB production using an existing engineered strain. This enables the implementation of the purification system designed in this project. Future work can explore the possibility of producing and optimizing the PHB production with BioBrick standard parts.
Fusion protein validation
The newly designed and constructed affinity tags <partinfo>BBa_K300002</partinfo>, <partinfo>BBa_K300093</partinfo>, <partinfo>BBa_K300094</partinfo>, <partinfo>BBa_K300097</partinfo> were assembled to a constitutive or inducible promoter with RBS upstream and to a Silver fusion-compatible GFP coding sequence with terminator (<partinfo>BBa_K300005</partinfo>). The resulting measurement parts were assayed to validate the bacterial growth and GFP synthesis rate of the following constructs in order to verify the right protein folding.
Costitutive promoter devices
Methods
Inoculum (into 5 ml LB+Amp) from glycerol stock of:
- <partinfo>BBa_K300086</partinfo>
- <partinfo>BBa_K300088</partinfo>
- <partinfo>BBa_K300090</partinfo>
- <partinfo>BBa_K300099</partinfo>
- <partinfo>BBa_K173000</partinfo> (positive control, J23100 constitutive promoter expressing GFP)
- <partinfo>BBa_B0031</partinfo> (negative control, a non-fluorescent culture)
Cultures were grown ON at 37°C, 220 rpm.
The following day cultures were diluted 1:100 and let grow again for about five hours at 37°C, 220 rpm.
The optical density (O.D.) of each culture was than measured with TECAN Infinte F200. Samples were diluted in order to obtain the same O.D. equal to 0.02.
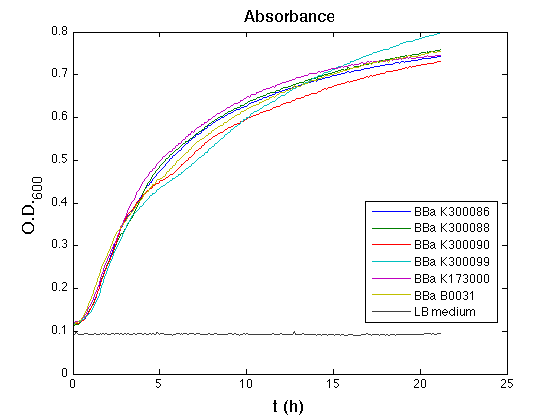
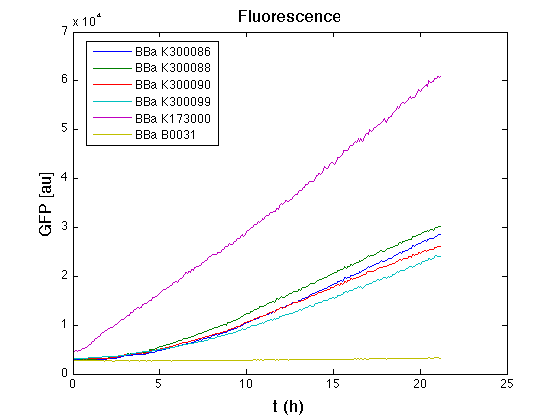
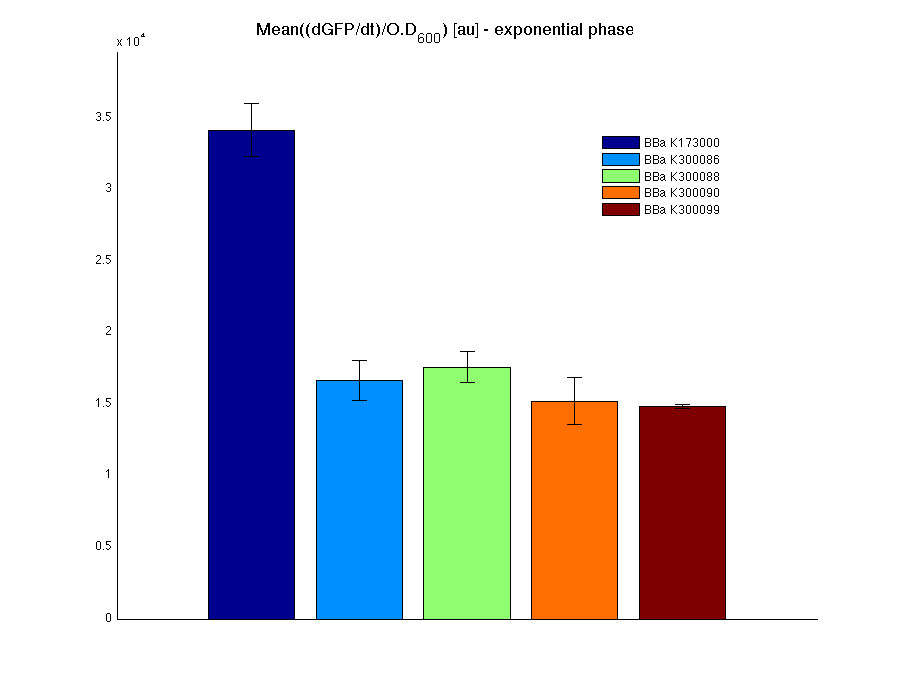
Then we performed a 21-hour experiment with measurements of absorbance and green fluorescence every five minutes with TECAN Infinite F200; cultures were shaken for 15 seconds every five minutes. Acquired data were blanked by subtracting the media absorbance (for absorbance measurements) and the <partinfo>BBa_B0031</partinfo> fluorescence (for fluorescence measurements). Then, the relative GFP synthesis rate per cell was evaluated by computing (1/O.D.600)*dGFP/dt, where O.D.600 is the blanked absorbance of the culture of interest and GFP is its blanked fluorescence. Each value shown below is the mean of three measurements in exponential phase and error bars represent the 95% confidence interval of the mean.
Results
| Culture | Doubling time [min.] ± std error |
|---|---|
| <partinfo>BBa_K173000</partinfo> | 76.3336 ± 1.4362 |
| <partinfo>BBa_K300086</partinfo> | 73.6685 ± 1.6245 |
| <partinfo>BBa_K300088</partinfo> | 74.8806 ± 2.7699 |
| <partinfo>BBa_K300090</partinfo> | 75.9433 ± 3.6808 |
| <partinfo>BBa_K300099</partinfo> | 78.4634 ± 2.5622 |
| <partinfo>BBa_B0031</partinfo> | 70.8421 ± 2.2181 |
Discussion
All the cultures showed a similar growth curve; doubling time was computed as described here in order to obtain information about the metabolic burden due to the synthesis of the studied fusion proteins. It is possible to see that all doubling times are comparable; it is possible to assert that the expression of these BioBrick parts doesn't cause abnormal stress to the cells.
From GFP curve it is possible to appreciate that in <partinfo>BBa_K300086</partinfo>, <partinfo>BBa_K300088</partinfo>, <partinfo>BBa_K300090</partinfo>, <partinfo>BBa_K300099</partinfo> GFP accumulation is very similar and it is significantly different from the one of the negative control <partinfo>BBa_B0031</partinfo>. These results show that the green fluorescent protein assembled downstream of the genetic circuit is correctly folded.
The mean protein synthesis rate was also computed over the exponential growth phase, showing again an appreciable GFP production rate that is about half of the positive control GFP.
3OC6HSL inducible devices
Methods
Inoculum (into 5 ml LB+Amp) from glycerol stock of:
- <partinfo>BBa_K300091</partinfo>
- <partinfo>BBa_K300092</partinfo>
- <partinfo>BBa_K173000</partinfo> (positive control)
- <partinfo>BBa_B0031</partinfo> (negative control)
Cultures were grown ON at 37°C, 220 rpm.
The following day cultures were diluted 1:100 and let grow again for about five hours at 37°C, 220 rpm.
The optical density (O.D.) of each culture was than measured with TECAN Infinte F200. Samples were diluted in order to obtain the same O.D. equal to 0.02.
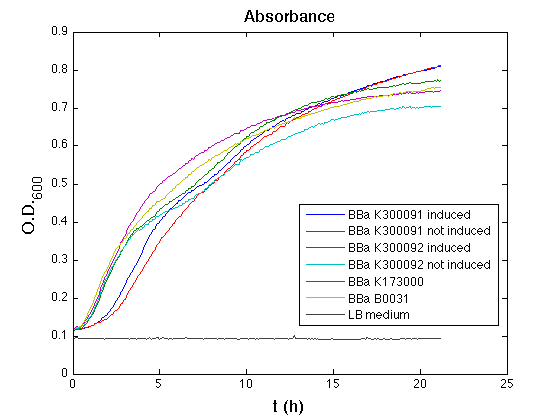
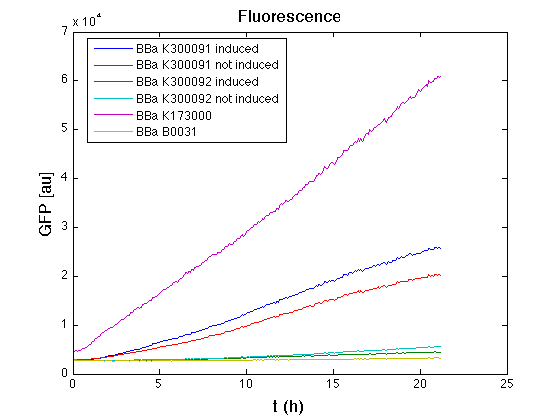
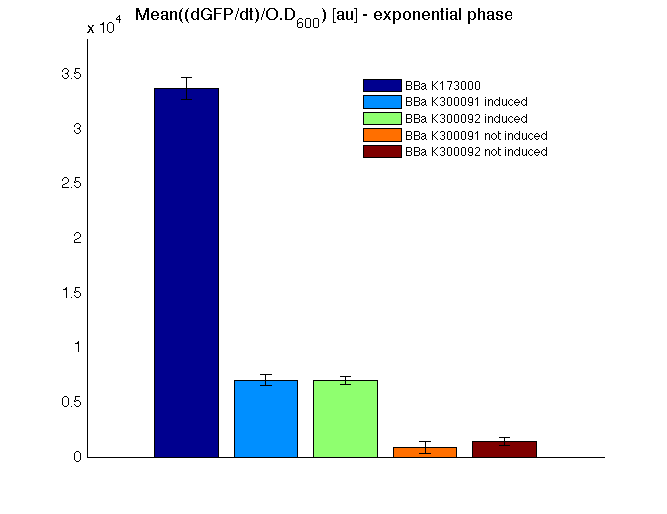
Then we performed a 21-hour experiment with measurements of absorbance and green fluorescence every five minutes using TECAN Infinite F200; cultures were shaken for 15 seconds every five minutes. <partinfo>BBa_K300091</partinfo> and <partinfo>BBa_K300092</partinfo> constructs were induced with 100nM of HSL directly in the 96-well microplate. Acquired data were blanked by subtracting the media absorbance (for absorbance measurements) and the <partinfo>BBa_B0031</partinfo> fluorescence (for fluorescence measurements). Then, the relative GFP synthesis rate per cell was evaluated by computing (1/O.D.600)*dGFP/dt, where O.D.600 is the blanked absorbance of the culture of interest and GFP is its blanked fluorescence. Each value shown below is the mean of three measurements in exponential phase and error bars represent the 95% confidence interval of the mean.
Results
| Culture | Doubling time [min.] ± std error |
|---|---|
| <partinfo>BBa_K173000</partinfo> | 76.3336 ± 1.4362 |
| <partinfo>BBa_K300091</partinfo> induced | 121.1434 ± 7.0275 |
| <partinfo>BBa_K300091</partinfo> not induced | 74.4267 ± 1.3696 |
| <partinfo>BBa_K300092</partinfo> induced | 122.6088 ± 1.2785 |
| <partinfo>BBa_K300092</partinfo> not induced | 71.5105 ± 2.7113 |
| <partinfo>BBa_B0031</partinfo> | 70.8421 ± 2.2181 |
Discussion
All the cultures showed a similar growth curve; doubling time was computed as described here in order to obtain information about the burden due to the synthesis of such fusion proteins. It is possible to see that all doubling times are very similar except for induced cultures. In this case doubling time is much higher than both positive control and non-induced cultures; for this reason it is possible to assert that induction gives a high metabolic burden.
From GFP curve and mean protein synthesis rate it is possible to appreciate that induced <partinfo>BBa_K300091</partinfo> and <partinfo>BBa_K300092</partinfo> GFP accumulation profiles are comparable and they significantly differ from the GFP raw time series of the negative control <partinfo>BBa_B0031</partinfo>. On the other hand not induced <partinfo>BBa_K300091</partinfo> and <partinfo>BBa_K300092</partinfo> show a profile that is very similar to the negative control. These results show that the green fluorescent protein assembled downstream of the construct is correctly folded and that the inducible system works as expected.
Not induced <partinfo>BBa_K300091</partinfo> and <partinfo>BBa_K300092</partinfo> show a low GFP synthesis rate maybe due to 3OC6HSL inducible circuit leakage activity.
Submitted fusion bricks for self-cleaving affinity tag construction
The results shown above have demonstrated that the right folding can occur in a proof of concept fusion protein assembled with the newly designed synthetic affinity tags. However, the Phasin affinity with PHB granules and the self-cleavage behaviour of the Intein have not been tested yet.
Several BioBrick basic and composite parts have been submitted to the Registry to enable the construction of the desired composite affinity tags for protein purification using PHB. All these parts are compatible with the Silver fusion assembly to allow in-frame protein coding sequence assembly. A list of the designed and submitted affinity tags or self-cleavable affinity tags is reported below:
- <partinfo>BBa_K300002</partinfo> (DNA Sent)
- <partinfo>BBa_K300003</partinfo> (DNA Sent)
- <partinfo>BBa_K300004</partinfo> (DNA Sent)
- <partinfo>BBa_K300079</partinfo> (DNA Sent)
- <partinfo>BBa_K300080</partinfo> (DNA Sent)
- <partinfo>BBa_K300081</partinfo> (DNA Sent)
- <partinfo>BBa_K300083</partinfo> (DNA Sent)
- <partinfo>BBa_K300084</partinfo> (DNA Sent)
- <partinfo>BBa_K300093</partinfo>
- <partinfo>BBa_K300094</partinfo>
- <partinfo>BBa_K300095</partinfo>
- <partinfo>BBa_K300097</partinfo>
Registry users are welcome to use them to create and optimize protein purification through the binding of the target protein to PHB granules, thus engineering a simple and cheap purification system.
 "
"
