|
CHARACTERIZATION
All our parts
Our new parts
Self-inducible promoters'
Exploiting quorum sensing mechanism...
Different studies demonstrated that bacteria, such as V. fischeri, can communicate through a mechanism called quorum sensing and regulate genic expression relying on cell culture density. One of the most studied organisms is V. fischeri, for which the quorum sensing is regulated by two genes: luxI and luxR. The first one encodes a protein responsible for the synthesis of homoserine-lactone, also called the auto-inducer. The second one encodes a protein capable to bind the HSL, once it has reached a critical concentration, making a complex that activates the transcription of genes under the regulation of the lux pR promoter. As the concentration of HSL is an increasing function of cell culture density, the induction of the lux pR promoter occurs only when the O.D.600 reaches a threshold concentration.
Taking inspiration from this natural mechanism, a library of self inducible promoters was built, exploiting the quorum sensing in E. coli.
Parts
Two BioBrick parts already present in the registry were used in this module. The luxI coding sequence (<partinfo>BBa_K081008</partinfo>) was assembled upstream of the double terminator <partinfo>BBa_B0015</partinfo>, thus obtaining the fundamental part to build self-inducible circuits, <partinfo>BBa_K300009</partinfo> (Fig. 1).
This part was used as signal generator, while the signal receiver part is <partinfo>BBa_F2620</partinfo>. In order to build a library of self-inducible promoters, another foundamental device was obtained by assembling <partinfo>BBa_K300009</partinfo> upstream of <partinfo>BBa_F2620</partinfo>, thus obtaining the part <partinfo>BBa_K300010</partinfo> (Fig. 2).
This systems have the behaviour shown in figure (Fig. 3)
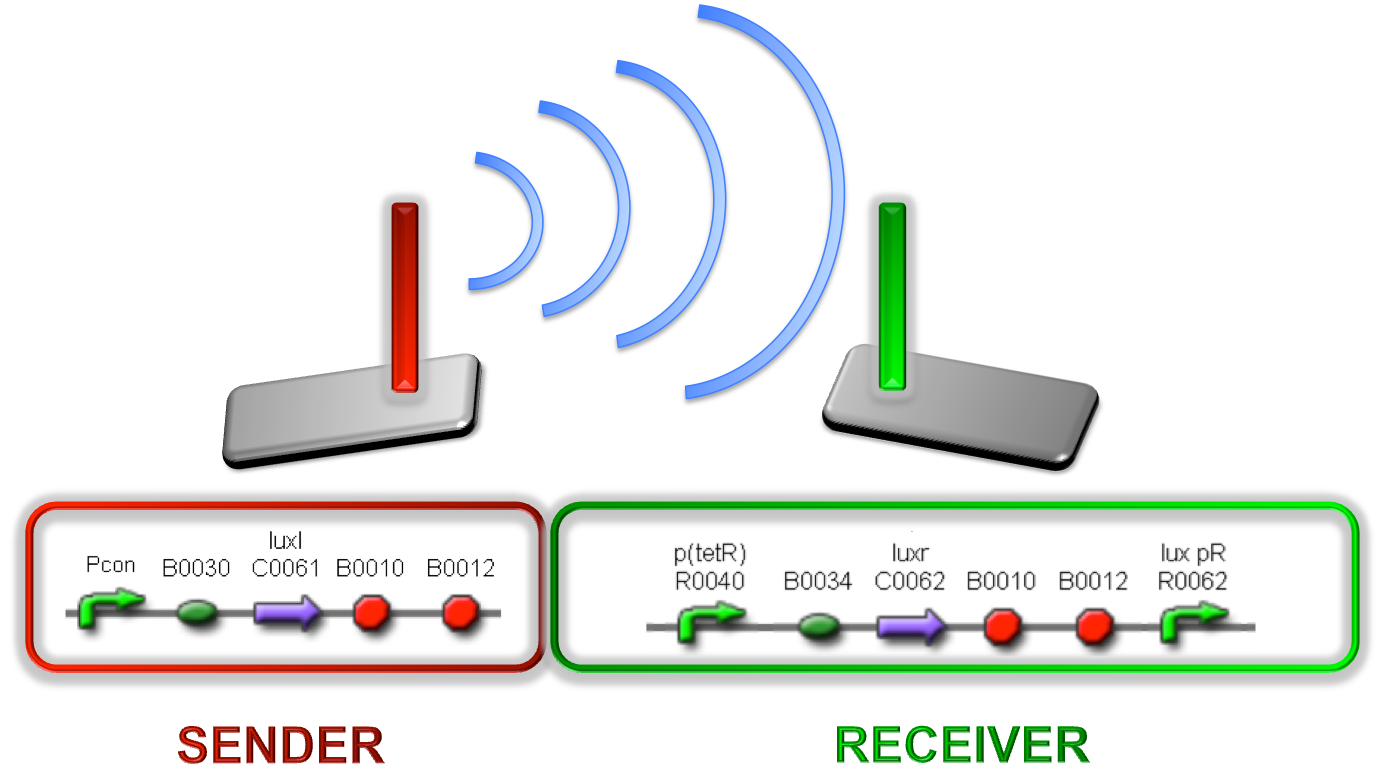 Figure 3 - Sender/receiver behaviour exploited to obtain self-inducible devices This part was assembled downstream of different constitutive promoters, thus obtaining a signal molecule generator. The choice of constitutive promoters was performed between the ones belonging to the Anderson’s promoters collection ; we chose promoters according to their activities reported in the Registry of Standard Biological Parts, in order to have a thick mesh:
| Promoter | Strength (a.u.)
reported in the Registry
|
| <partinfo>BBa_J23100</partinfo> | 2547
|
| <partinfo>BBa_J23101</partinfo> | 1791
|
| <partinfo>BBa_J23105</partinfo> | 623
|
| <partinfo>BBa_J23106</partinfo> | 1185
|
| <partinfo>BBa_J23110</partinfo> | 844
|
| <partinfo>BBa_J23114</partinfo> | 256
|
| <partinfo>BBa_J23116</partinfo> | 396
|
| <partinfo>BBa_J23118</partinfo> | 1429
|
Before constructing the signal generators, <partinfo>BBa_K300009</partinfo> under the regulation of one of these constitutive promoters, we evaluated their activities in Relative Promoter Units (R.P.U.) according to Data analysis for RPU evaluation, using the reporter protein R.F.P. in different experimental conditions (plasmids’ copy number and growth medium) :
- high copy number plasmids and LB;
- high copy number plasmids and M9;
- low copy number plasmids and M9.
It was not possible to evaluate promoters activities in low copy number plasmids and LB because the RFP activity was too weak and not detectable and discernible from the background.
Red Fluorescent Protein (RFP) fluorescence and Optical Density at 600nm (O.D.600) were measured by Tecan Infinite F200 as reported in Microplate reader experiments for constitutive promoters (R.P.U. evaluation) - Protocol #2 and data were analyzed as reported in DATA Analysis RPU; results are shown here:
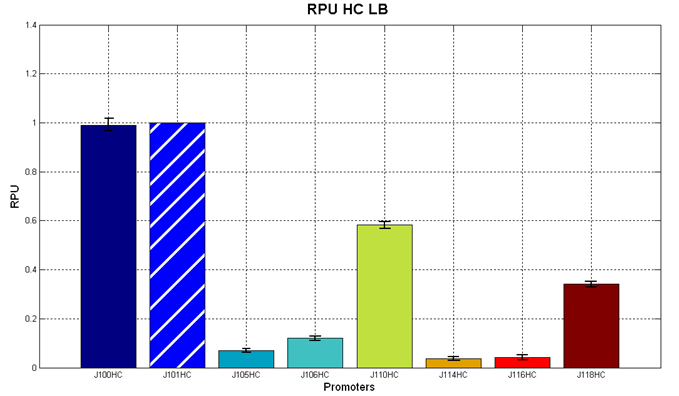 Figure 4 - R.P.U. of some promoters from Anderson promoters' collection, LB medium and high copy plasmid (<partinfo>BBa_J61002</partinfo>) | 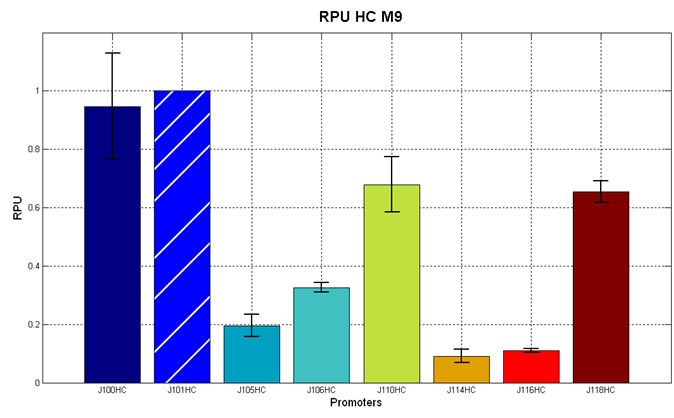 Figure 5 - R.P.U. of some promoters from Anderson promoters' collection, M9 medium and high copy plasmid (<partinfo>BBa_J61002</partinfo>) |
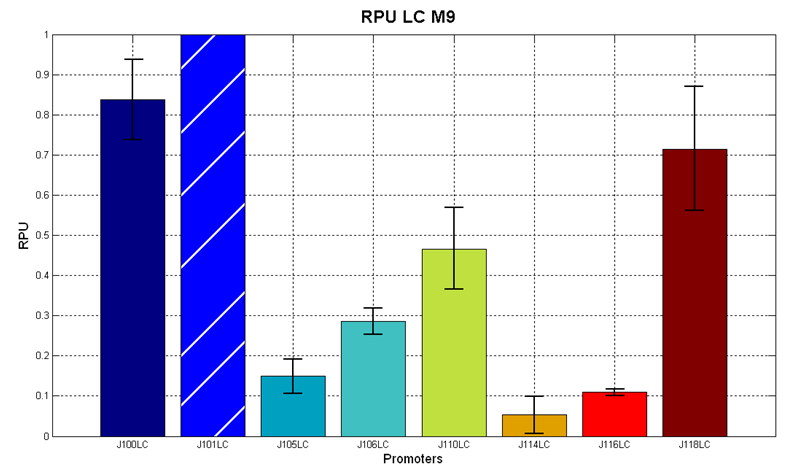 Figure 6 - R.P.U. of some promoters from Anderson promoters' collection, LB medium and high copy plasmid (<partinfo>pSB4C5</partinfo>) |
We observed that the Registry ranking is not always respected. As an example, <partinfo>BBa_J23110</partinfo> in high copy plasmid is stronger than <partinfo>BBa_J23118</partinfo>, in contrast with the ranking of the Registry.
After the evaluation of promoters’ activity, signal generators were constructed in high copy and low copy plasmids: <partinfo>BBa_K300009</partinfo> and <partinfo>BBa_K300010</partinfo> were assembled downstream the above mentioned promoters, thus obtaining the following parts:
| BioBrick | Description
|
| <partinfo>BBa_K300030</partinfo> | 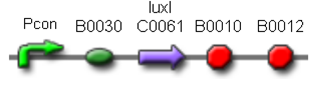
J23118
|
| <partinfo>BBa_K300028</partinfo> |
J23110
|
| <partinfo>BBa_K300029</partinfo> |
J23116
|
| <partinfo>BBa_K300025</partinfo> |
J23101
|
| <partinfo>BBa_K300026</partinfo> |
J23105
|
| <partinfo>BBa_K300027</partinfo> |
J23106
|
| <partinfo>BBa_K300017</partinfo> | 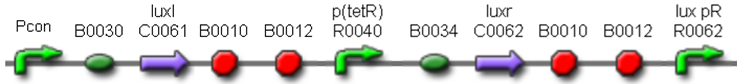
J23118
|
| <partinfo>BBa_K300014</partinfo> |
J23110
|
| <partinfo>BBa_K300015</partinfo> |
J23114
|
| <partinfo>BBa_K300016</partinfo> |
J23116
|
| <partinfo>BBa_K300012</partinfo> |
J23105
|
Some of the promoters probably induce a production of LuxI that is injurious for E. coli, so it wasn’t possible to exploit all the combinations.
For every part, a measurement system was built, exploiting the production of the reporter gene GFP to evaluate the trascription initiation point for every promoter. Many different combination were explored, in order to provide a library of promoters capable of initiate transcription at the desired culture density.
Besides the use of constitutive promoters of different strength to regulate the production of the signal molecule, another parameter took into consideration is the plasmid copy number. Signal generator and sensor device
The new parts were, thus, characterized, measuring the HSL concentration after a 6 hour growth of the cultures (Protocollo2). Cultures were centrifuged and supernatants were filtered, diluted and used to induce BBa_T9002 (a sensor of 3OC6HSL concentration) cultures. BBa _T9002 were also induced with known concentration of HSL, in order to have a kind of calibration line of the sensor. Fluorescence was measured, so that it was possible to deduce the unknown HSL concentration in cultures (Figure 5).
Figure 7 -BBa_K300009 assembled downstream a constitutive promoter The new BioBrick parts were constructed starting from BBa_K081008, the luxI coding sequence; the production rate of 3OC6HSL is proportional to the activity of the promoter.
To test the auto-induction we assembled a new BioBrick part, merging the 3OC6HSL generators with BBaT9002. This BioBrick parts were also ligated in both high copy and low copy number plasmids.
In order to exploit the quorum sensing mechanism in E. coli we also cotransformed TOP10 strains with 3OC6HSL generators in low copy number plasmids and the sensor BBaT9002 in a high copy number plasmid.
+
LC HC
We evaluated these genetic circuits in LB and M9 and found out that the auto-induction occurs at different phases of bacterial growth as we planned. Switch-points were calculated according to the algorithm [reference].
Figure 7 – Average growth curve with switch points OD_600 (M9)
Thus, these BioBrick parts can be used to express recombinant proteins without adding an inducer to trigger the transcription of their genes; in large-scale production of such proteins this strategy could be also cost saving.
Growth conditions
Microplate reader experiments for self-inducible promoters - Protocol #1
- 8 ul of long term storage glycerol stock were inoculated in 1 ml of LB or M9 + suitable antibiotic in a 15 ml falcon tube and incubated at 37°C, 220 rpm for about 16 hours.
- The grown cultures were then diluted 1:100 in 1 ml of LB or M9 supplemented medium and incubated in the same conditions as before for about 4 hours.
- These new cultures were then pelletted (2000 rpm, 10 minutes) in order to eliminate the HSL produced during the growth.
- Supernatants were discarded and the pellets were resuspended in 1 ml of LB or M9 + suitable antibiotic and transferred to a 1.5 ml tube
- These cultures were diluted 1:1000 in 1 ml of LB or M9 + suitable antibiotic and aliquoted in a flat-bottom 96-well microplate in triplicate, avoiding to perform dynamic experiments in the microplate frame (in order to prevent evaporation effects in the frame). All the wells were filled with a 200 ul volume.
- The microplate was incubated in the Tecan Infinite F200 microplate reader and fluorescence and absorbance were measured with this automatic protocol:
- 37°C constant for all the experiment;
- sampling time of 5 minutes;
- fluorescence gain of 50;
- O.D. filter was 600 nm;
- GFP filters were 485nm (ex) / 540nm (em);
- 15 seconds of linear shaking (3mm amplitude) followed by 10 seconds of waiting before the measurements in order to make a homogeneous culture.
- Variable experiment duration time (from 3 to 24 hours).
Microplate reader experiments for constitutive promoters (R.P.U. evaluation) - Protocol #2
- 8 ul of long term storage glycerol stock were inoculated in 5 ml of LB or M9 + suitable antibiotic in a 15 ml falcon tube and incubated at 37°C, 220 rpm for about 16 hours.
- The grown cultures were then diluted 1:100 in 5 ml of LB or M9 supplemented medium and incubated in the same conditions as before for about 4 hours.
- These new cultures were diluted to an O.D.600 of 0.02 (measured with a TECAN F200 microplate reader on a 200 ul of volume per well; it is not comparable with the 1 cm pathlength cuvette) in 2ml LB or M9 + suitable antibiotic. In order to have the cultures at the desired O.D.600, the following dilution was performed:
- These new dilutions were aliquoted in a flat-bottom 96-well microplate, avoiding to perform dynamic experiments in the microplate frame (see Frame effect section for details). All the wells were filled with a 200 ul volume.
- The microplate was incubated in the Tecan Infinite F200 microplate reader and fluorescence (when required) and absorbance were measured with this automatic protocol:
- 37°C constant for all the experiment;
- sampling time of 5 minutes;
- fluorescence gain of 50;
- O.D. filter was 600 nm;
- GFP filters were 485nm (ex) / 540nm (em);
- 15 seconds of linear shaking (3mm amplitude) followed by 10 seconds of waiting before the measurements in order to make a homogeneous culture.
- Experiment duration time (about 6 hours).
Microplate reader experiments for 3OC6-HSL quantification by means of <partinfo>BBa_T9002</partinfo> sensor - Protocol #3
The aim of this experiment is the quantification of the 3OC6-HSL produced by a culture bearing a plasmid derived from <partinfo>BBa_K300009</partinfo> (wiki name: I3), where luxI expression is regulated by a constitutive promoter of Anderson promoters collection (see more on project section for the design of these devices). These parts are 3OC6-HSL generators and one important parameter to be evaluated is the concentration of 3OC6-HSL produced.
The "3OC6-HSL generator" culture was processed as follows:
- Preparation of samples of 3OC6-HSL to quantify:
- 8 ul of long term storage glycerol stock were inoculated in 5 ml of LB + suitable antibiotic in a 15 ml falcon tube and incubated at 37°C, 220 rpm for about 16 hours.
- The grown cultures were then diluted 1:100 in 5 ml of LB supplemented medium and incubated in the same conditions as before for about 6 hours.
- O.D.600 was measured, to verify that the growths were synchronized and, if not, final O.D.600 was considered as a correction factor to normalize the amount of 3OC6-HSL produced per cell.
- When all the cultures had reached the saturation phase, each falcon was pelletted (2000 rpm, 10 minutes) and supernatants were collected and filtered 0,2 um, in order to eliminate unwanted bacterial residues. These supernatants contained the 3OC6-HSL at the concentration produced by cultures. These supernatants will be used to "induce" <partinfo>BBa_T9002</partinfo> cultures, in order to quantify the [HSL]. They were stocked at -20°C till next day
- Growth and preparation of the "sensor" culture of <partinfo>BBa_T9002</partinfo>
- 8 ul of long term storage glycerol stock were inoculated in 5 ml of LB + suitable antibiotic in a 15 ml falcon tube and incubated at 37°C, 220 rpm for about 16 hours.
- The grown cultures were then diluted 1:100 in 5 ml of LB supplemented medium and incubated in the same conditions as before till they reach an O.D. 0,07 (Tecan INFINITE F200).
- 200 ul of culture were transferred in each well of a 96-well microplate.
- Calibration curve
- A calibration curve was obtained, by inducing in triplicate wells of <partinfo>BBa_T9002</partinfo> with different HSL concentrations:
- 10 uM
- 1 uM
- 100 nM
- 50 nM
- 10 nM
- 5 nM
- 2 nM
- 1 nM
- 0,5 nM
- 0,1 nM
- 0 M
- All inductions were performed adding 2ul of "inducer solution" at a proper concentration in 200 ul of culture.
- HSL quantification
- 2ul of supernatants prepared as described above were used to induce 200 ul of <partinfo>BBa_T9002</partinfo> cultures in triplicate.
- If the amount of 3OC6-HSL present in the supernatant was not enough concentrated to trigger the induction of <partinfo>BBa_T9002</partinfo>, a bigger amount of supernatant (X ul) was used to induce the cultures (200-X ul) and the calibration curve was obtained by using the same amount of <partinfo>BBa_T9002</partinfo> culture (200-X ul) and the 3OC6-HSL diluted in X ul of supernatant of a negtaive control.
- Fluorescence was measured and, using the information provided by the calibration curve, the amount of 3OC6-HSL present in every supernatant was evaluated (each value "read" on the calibration curve was corrected for the proper dilution factor and for the proper correction factor dependent on the final O.D.600)
Data Analysis
- All our growth curves have been obtained subtracting for each time sample the broth O.D.600 measurement from that of the culture; broth was considered in the same conditions of the culture (e.g. induced with the same inducer concentration and supplemented with the same antibiotic of the culture).
- Fluorescence signals have been obtained subtracting for each time sample the fluorescent measurement of a non-fluorescent culture from that of the target culture. The non-fluorescent culture was considered in the same conditions of the target (e.g. induced with the same inducer concentration and with the BioBrick carried by the same plasmid, not encoding a fluorescent protein). This operation allows the removal, from the target fluorescent signal, of the "self-fluorescent" component and the fluorescence signal obtained is "blanked".
Doubling time evaluation
The natural logarithm of the growth curves (processed according to the above section) was computed and the linear phase (corresponding to the bacterial exponential growth phase) was isolated by visual inspection. Then the linear regression was performed in order to estimate the slope of the line m. Finally the doubling time was estimated as d=ln(2)/m [minutes].
In the case of multiple growth curves for a strain, the mean value of the processed curves was computed for each time sample before applying the above described procedure.
Data analysis for self-inducible promoters (initiation-treshold determination)
The task of our analysis is the evaluation of the initiation transcription point (in term of absorbance) for self-inducible devices. The transiction O.D.600 value is named, from now on, ODstart.
Data from three indipendent wells were averaged and blanked. O.D.600 signals were blanked as described in "Preliminary Remarks" section, while the fluorescence signal was blanked with the fluorescence of <partinfo>BBa_T9002</partinfo> part, assembled in the same plasmid of the considered promoter. This operation allows the removal from the fluorescence signal of the “self-fluorescent” component and of the “leaky ” component (due to the leakage of pLux in absence of the autoinducer molecule HSL).
ODstart was evaluated by computing the Scell signal for the desired self-inducible promoter and for the negative control.
Two different signals, measured from independent samples of the same non-fluorescent culture in the same experiment, are considered: C1 and C2. The fluorescence signal of C1 and C2 can be thought as the addition of a “real signal” and of a noise component.
since they are two time series acquired from the same culture, in the same growth condition by the same instrument.
F_C1 and F_C2 have the same expected value and the same standard deviation, since they are two independent realizations of the same aleatory process: in fact, they are two time series acquired from the same cultures, in the same growth conditions by the same instrument.
Noise signal was computed as:
The behaviour of the signal N is shown in figure:
An interesting signal is Scell of N. It can be evaluated as the time derivative of N, divided by O.D.600 of the culture. It has the behaviour shown in figure:
It is fair to say that the noise of Scell is bigger for low O.D.600 values and its width decreases dramatically for higher O.D.600 values (e.g.: O.D.600>0,1 TECAN infinite F200).
The noise model proposed for the Scell noise signal is:
Once derived the noise of the Scell signal, the evaluation of the O.D.start can be performed supposing that the signal is significantly growing when at least 5 consecutive time samples exceed a threshold defined as follows:
The operation of subtracting the two signals F_C1 and F_C2 is analogous to the “blanking” operation performed on data, as described previously. For, this reason, under the hypothesis that the signals have the same variance (this is a consistent hypothesis, since they are measured by the same instrument in the same experimental conditions), this argument can be extended to the “blanked” data considered in the processing.
In particular, it is evident that the "blanked" signal is affected by the same noise described above and thus, the noise of SCell signal is analogous to the one described before.
Thus, this threshold was used to compute the O.D.start for the cultures. This heuristic algorithm was implemented in Matlab and analysis results are reported in the “results” section.
Data analysis for RPU evaluation
The RPUs are standard units proposed by Kelly J. et al., 2008, in which the transcriptional strength of a promoter can be measured using a reference standard.
RPUs have been computed as:
in which:
- phi is the considered promoter and J23101 is the reference standard promoter (taken from Anderson Promoter Collection);
- F is the blanked fluorescence of the culture, computed subtracting for each time sample fluorescence measure for negative control from that of culture, where the negative control is a non-fluorescent strain (in our experiment it is usually used TOP10 strain bearing BBa_B0032 or BBa_B0033, which are symply RBSs do not have expression systems for reporter genes);
- ASB is the blanked absorbance (O.D.600) of the culture, computed as described in "Preliminary remarks" section.
RPU measurement has the following advantages (under suitable conditions)
- it is proportional to PoPS (Polymerase Per Second), a very important parameter that expresses the transcription rate of a promoter;
- it uses a reference standard and so measurements can be compared between different laboratories.
The hypotheses on which RPU theory is based can be found in Kelly J. et al., 2008, as well as all the mathematical steps. From our point of view, the main hypotheses that have to be satisfied are the following
- the reporter protein must have a half life higher than the experiment duration (we use GFPmut3, BBa_E0240, which has an estimated half life of at least 24 hours, and the experiments duration is always less than 7 hours);
- strain, plasmid copy number, antibiotic, growth medium, growth conditions, protein generator assembled downstream of the promoter must be the same in the promoter of interest and in J23101 reference standard.
- steady state must be valid, so (dF/dt)/ASB (proportional to the GFP synthesis rate per cell) must be constant.
In order to compute the RPUs, the Scell signals ((dGFP/dt)/ASB)) of the promoter of interest and of the reference J23101 were averaged in the time interval corresponding to the exponential growth phase. The boundaries of exponential phase were identified with a visual inspection of the linear phase of the logarithmic growth curve.
|
 "
"