Team:TU Delft/Project/solubility/results
From 2010.igem.org

Solubility Results & Conclusions
Our goal is to enhance the solubility of alkanes in water. Therefore we constructed a new part that expresses the emulsifier protein AlnA after induction by IPTG. By using our own emulsification assay we measured the increase of hydrophobic compounds in the water phase.
Results
For the production of large amounts of protein, 1 L shake flasks cultures were induced with IPTG after the OD measuremnts indicated the start of the exponential phase. The experiment was done performed three times with iterative improvements.
Experiment 1
In this experiment we used a large volume (1 L) at 37 C. The OD measurements at the induction time point and harvest are shown in Table 1.
Table 1: OD600 of the cultures at IPTG induction and harvest.
| # | Culture | OD600 at induction | OD600 at harvest |
| 1 | Control (J13002) 37 C | 0.367 | 0.882 |
| 2 | AlnA (K398206) 37 C | 0.434 | 0.880 |
The total volume of sample at the end after completion of the isolation protocol was 3 mL. The protein concentration was determined by Bradford analysis and showed that the control contained 19 mg mL-1 and the AlnA sample contained 16 mg mL-1.
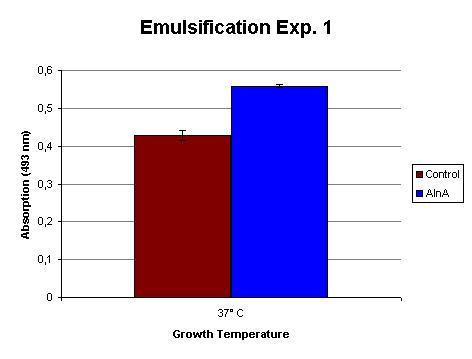
The emulsification capacity of the protein mixture was determined using our emulsifier assay. 0.75 mg protein was used in the assay displayed in Figure 2. The 30% increase in absorption in the AlnA sample indicates a higher amount of Sudan II that is in solution, thus a higher emulsification by the proteins. A statistical T test shows that this is a significant increase (p = 3 x 10⁻³).
Experiment 2
The second experiment was carried out at two temperatures: 37 C and 30 C. It was expected that IPTG induction is stronger at lower temperatures. The OD measurements at the induction time point and harvest are shown in Table 2.
Table 2: OD600 of the cultures at IPTG induction and harvest.
| # | Culture | OD600 at induction | OD600 at harvest |
| 1 | Control (J13002) 30 C | 0.073 | 0.451 |
| 2 | Control (J13002) 37 C | 0.088 | 0.810 |
| 3 | AlnA (K398206) 30 C | 0.060 | 0.393 |
| 4 | AlnA (K398206) 37 C | 0.067 | 0.624 |
The total volume of sample at the end after completion of the isolation protocol was 1 mL. The protein concentration was determined by Bradford analysis and showed that from the culture grown at 37 C the control contained 1.7 mg mL-1 and the AlnA sample contained 1.5 mg mL-1. The control samples from the culture grown at 30 C contained 2.41 mg mL-1 and the AlnA sample contained 2.29 mg mL-1.
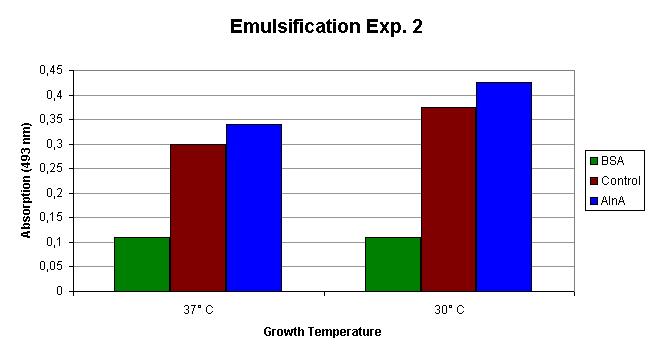
The emulsification capacity of the samples was determined using our emulsifier assay. 0.75 mg protein was used in the assay displayed in Figure 2. The 13% increase in absorption in the AlnA samples indicates a higher amount of Sudan II that is in solution, thus a higher emulsification by the proteins.
Experiment 3
The experiments were repeated one last time to confirm the observed emulsification capacity. The experiment was again carried out at 37 C and 30 C. The OD measurements at the induction time point and harvest are shown in Table 3.
Table 3: OD600 of the cultures at IPTG induction and harvest.
| # | Culture | OD600 at induction | OD600 at harvest |
| 1 | Control (J13002) 30 C | 0.111 | 0.462 |
| 2 | Control (J13002) 37 C | 0.119 | 0.700 |
| 3 | AlnA (K398206) 30 C | 0.110 | 0.435 |
| 4 | AlnA (K398206) 37 C | 0.113 | 0.616 |
The total volume of sample at the end after completion of the isolation protocol was 1 mL. The protein concentration was determined by Bradford analysis and showed that from the culture grown at 37 C the control contained 11.33 mg mL-1 and the AlnA sample contained 8.15 mg mL-1. The control samples from the culture grown at 30 C contained 5.49 mg mL-1 and the AlnA sample contained 8.49 mg mL-1.
The emulsification capacity of the samples was determined using our emulsifier assay. 0.75 mg protein was used in the assay displayed in Figure 2. The 26% increase in absorption in the AlnA samples at 30 C and 30% observed for the extract from cultures grown at 37 C indicate a higher amount of Sudan II that is in solution, thus a higher emulsification by the proteins.
Conclusions
For enabling E. coli to degrade hydrocarbons we equipped the cells with the ability to produce, AlnA, a known emulsifying protein. The production of the protein was induced by IPTG. Although known as a strong inducer, we were not able see the protein on an SDS-PAGE gel. This is probably due to a low protein synthesis of the cells when cultured in minimal medium.
Nevertheless the emulsification assays do show an increased emulsifying capacity by the expression of BBa_K398206. With our emulsifier assay we determined that an increased amount of hydrophobic Sudan II is dissolved compared to the control strain with BBa_J13002. According to our calibration curve with SDS, this increase corresponds to the emulsification capacity of 8 mM of SDS.
The use of cell extracts is not a final proof for AlnA activity, we can assume that the increased emulsification capacity is caused by the production of AlnA.
Work for next year teams
- In further research we would advise to add a tag to the protein, so it can be tracked and isolated with greater ease and purity.
- New research should also include the emulsification of alkanes. The lipophilicity of Sudan II (Log P of 6.00 [1]) is the equal to that of dodecane and about 1.5 times that of octane [2]. So, similar results are expected.
References
- Kallury et al (2007), Solid Phase Extraction for Detection of Sudan Dye Contaminants in Spices with HPLC/UV Detection, THE APPLICATION NOTEBOOK
- Jeppsson (1975), Parabolic Relationship between Lipophilicity and Biological Activity of Aliphatic Hydrocarbons, Ethers and Ketones after Intravenous Injections of Emulsion Formulations into Mice, Acta pharmacol. et toxicol

 "
"


