Team:TU Delft/Project/rbs-characterization/results
From 2010.igem.org
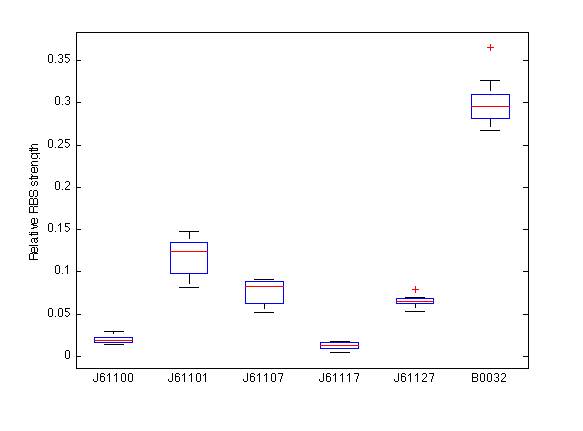
The resulting production rates (Beta from the model), are plotted in the boxplot below:
The given relative strengths are displayed assuming B0034 as the unit.
| RBS | Mean strength | Standard deviation |
| J61100 | 0.026560 | 0.005126 |
| J61117 | 0.123819 | 0.024725 |
| J61101 | 0.081210 | 0.013402 |
| J61107 | 0.019763 | 0.003963 |
| J61127 | 0.069657 | 0.007422 |
| B0032 | 0.300000 | 0.028316 |
 "
"
