Team:SDU-Denmark/project-r
From 2010.igem.org
(Difference between revisions)
(→Results) |
|||
| Line 7: | Line 7: | ||
'''Photosensor'''<br> | '''Photosensor'''<br> | ||
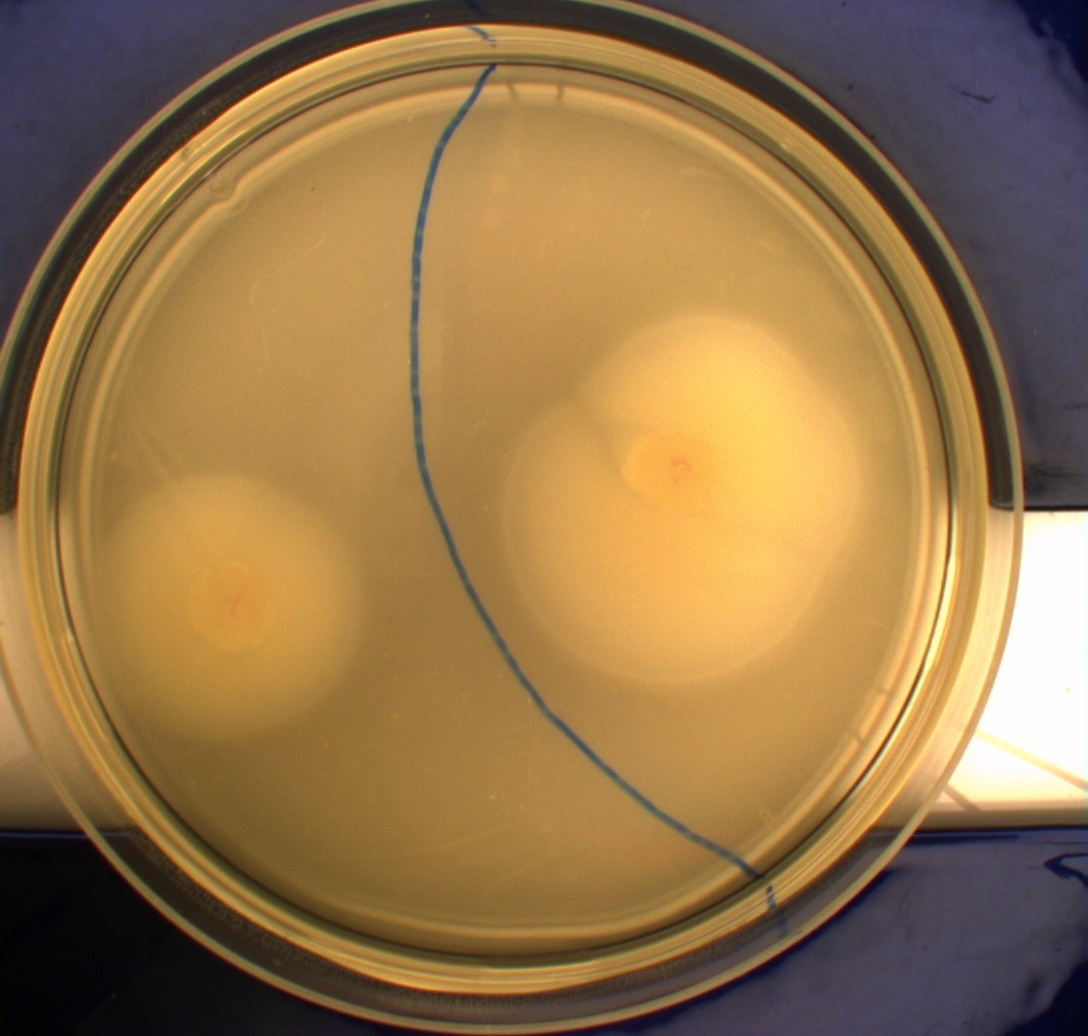
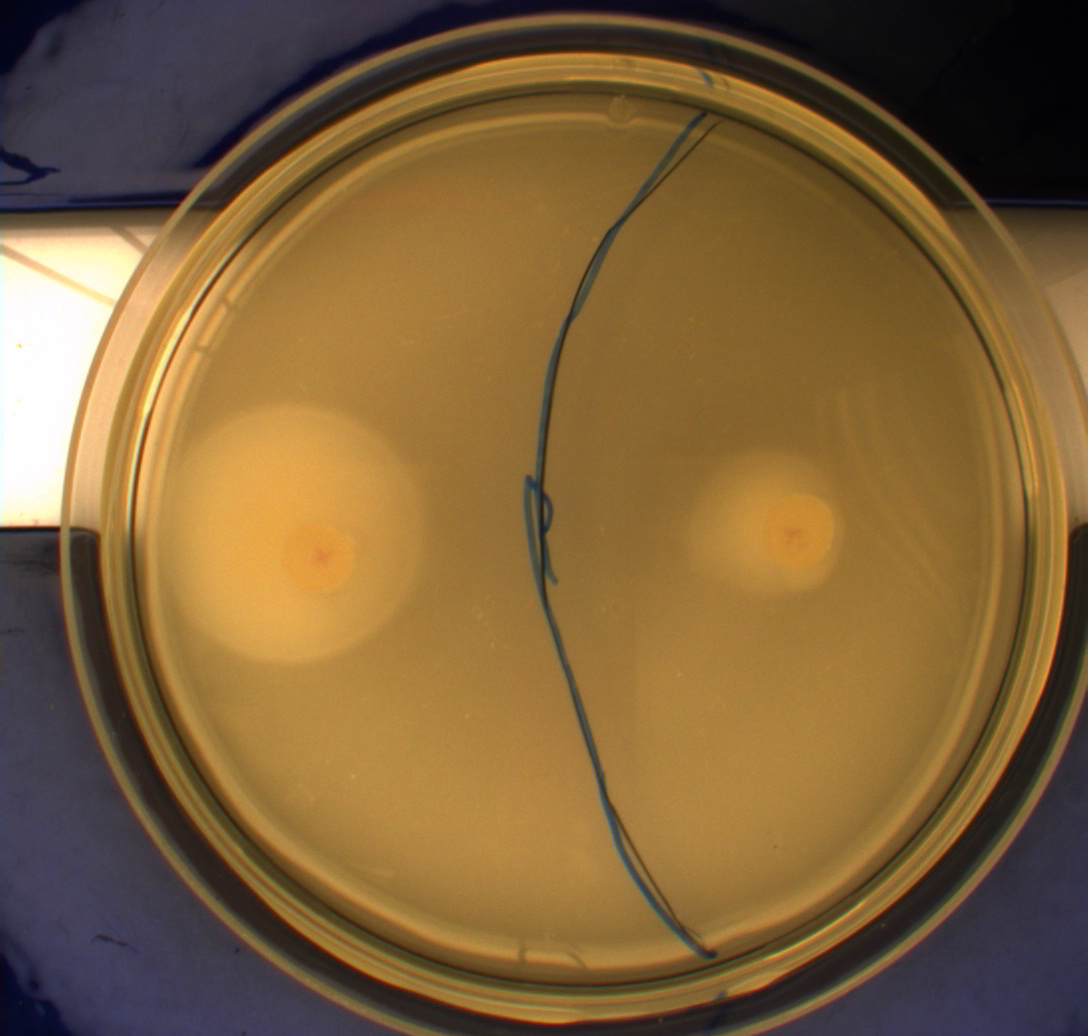
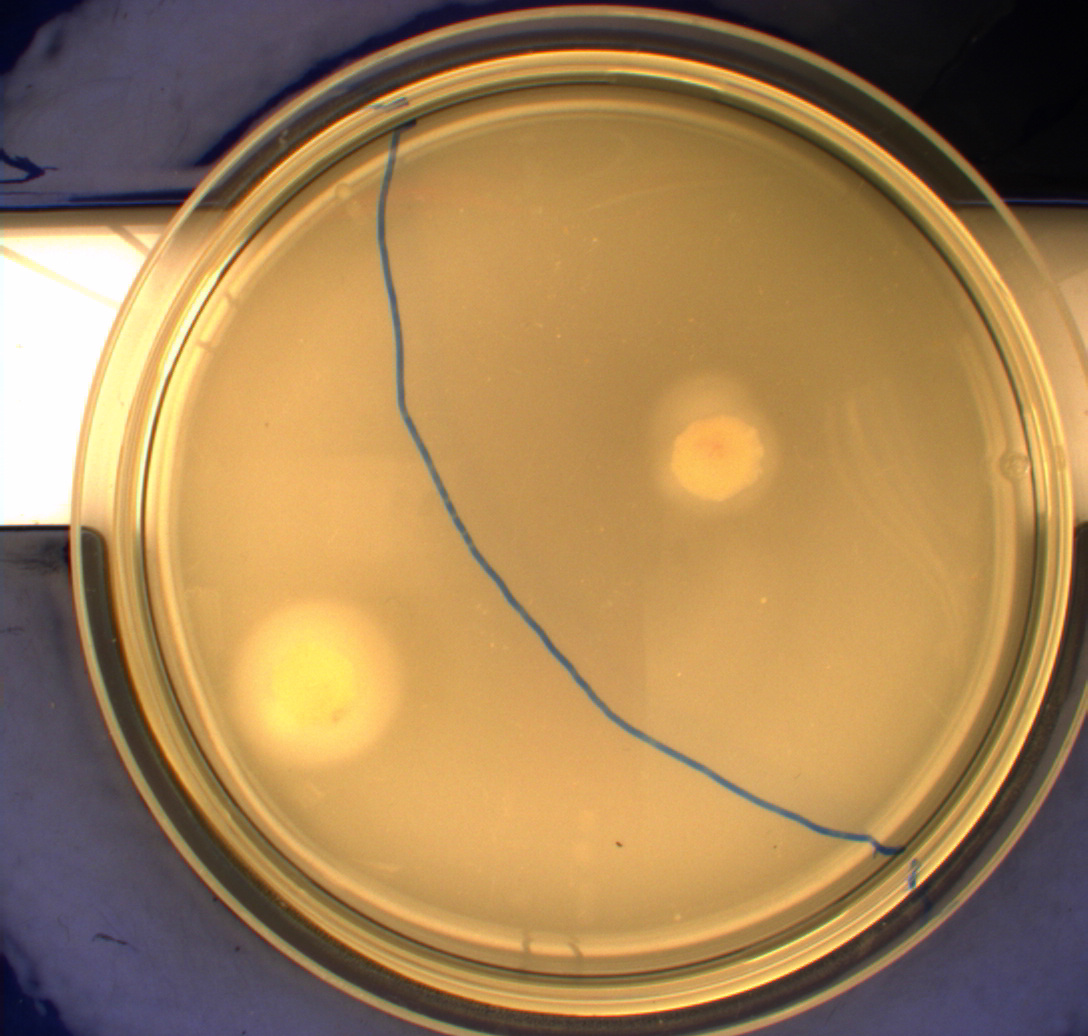
| - | + | Motility assay: In this experiment we shone blue light on one half of the plate, while the other half was in the dark. We then placed one colony in each half and observed their motility pattern after 24 hours. We did this for three different strains of E.Coli - DH5alpha, Wildtype Mg1655 and Mg1655 containing a plasmid with our photosensor constitutively on. See the results for yourself:<br> | |
Light shone on the right half of the plates, the left half was in the dark.<br> | Light shone on the right half of the plates, the left half was in the dark.<br> | ||
[[Image:Team-SDU-Denmark-MG1655.JPG|250px|thumb|right|MG1655]] | [[Image:Team-SDU-Denmark-MG1655.JPG|250px|thumb|right|MG1655]] | ||
| Line 22: | Line 22: | ||
Video microscopy results: | Video microscopy results: | ||
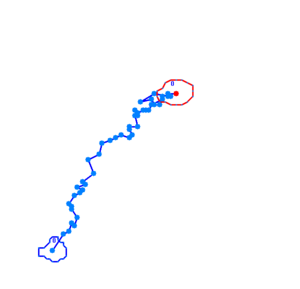
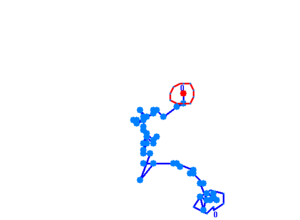
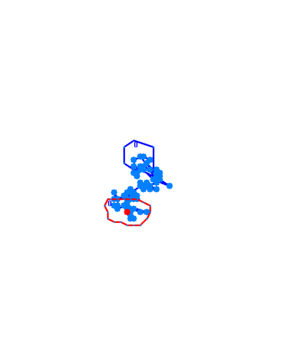
Bacteria containing the photosensor will exhibit a lowered tumbling rate when exposed to blue light (wavelengths around 350nm - 450nm). This was analysed with the help of video microscopy and the open source software [http://db.cse.ohio-state.edu/CellTrack/ "CellTrack"]. The individual cells trajectory was tracked and their speed measured. The tracking results are as follows: | Bacteria containing the photosensor will exhibit a lowered tumbling rate when exposed to blue light (wavelengths around 350nm - 450nm). This was analysed with the help of video microscopy and the open source software [http://db.cse.ohio-state.edu/CellTrack/ "CellTrack"]. The individual cells trajectory was tracked and their speed measured. The tracking results are as follows: | ||
| + | <br> | ||
| - | |||
| - | |||
[[Image:Team-SDU-Denmark-PSblue1.png |250px|frame|Photosensor bacteria exposed to blue light]] | [[Image:Team-SDU-Denmark-PSblue1.png |250px|frame|Photosensor bacteria exposed to blue light]] | ||
[[Image:PSred sample 1 trajectory - Cell 1.png |250px|frame|Photosensor bacteria exposed to red light (~580nm wavelength)]] | [[Image:PSred sample 1 trajectory - Cell 1.png |250px|frame|Photosensor bacteria exposed to red light (~580nm wavelength)]] | ||
Revision as of 07:50, 18 October 2010
 "
"
