Team:SDU-Denmark/project-r
From 2010.igem.org
(Difference between revisions)
(→Results) |
(→Results) |
||
| Line 38: | Line 38: | ||
'''UV-Vis spectrophotometer determination of beta-carotene production:'''<br> | '''UV-Vis spectrophotometer determination of beta-carotene production:'''<br> | ||
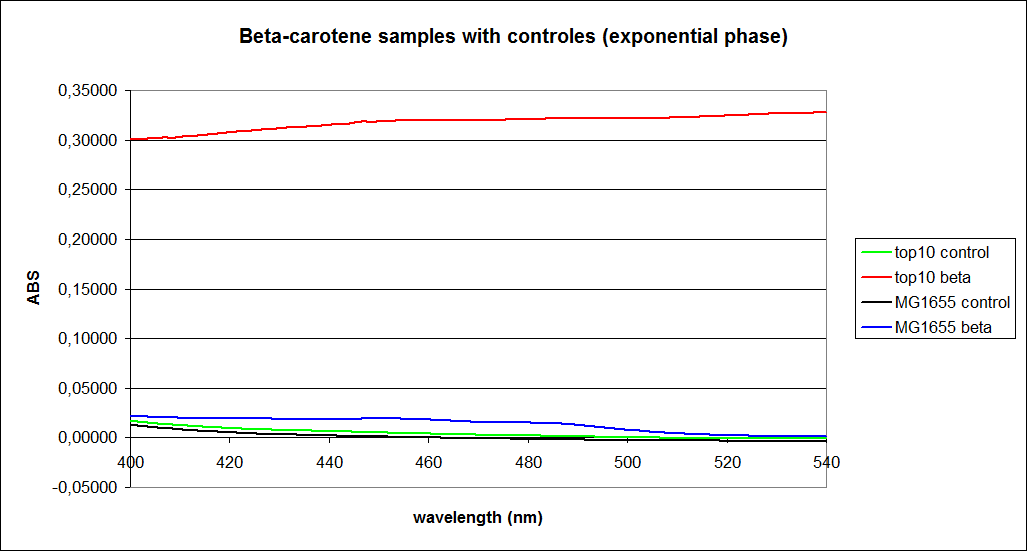
In this experiment cells was prepare and harvested according to protocol [https://2010.igem.org/Team:SDU-Denmark/protocols#EX1.1]. This experiment was preformed with four different strain of E. Coli – wildtype Top10, wildtype MG1655, Top10 containing PSB1A2 with K274210 constitutively active and MG1655 containing PSB1A2 with K274210 constitutively active. The resulting graphs is presented beneath the text<br> | In this experiment cells was prepare and harvested according to protocol [https://2010.igem.org/Team:SDU-Denmark/protocols#EX1.1]. This experiment was preformed with four different strain of E. Coli – wildtype Top10, wildtype MG1655, Top10 containing PSB1A2 with K274210 constitutively active and MG1655 containing PSB1A2 with K274210 constitutively active. The resulting graphs is presented beneath the text<br> | ||
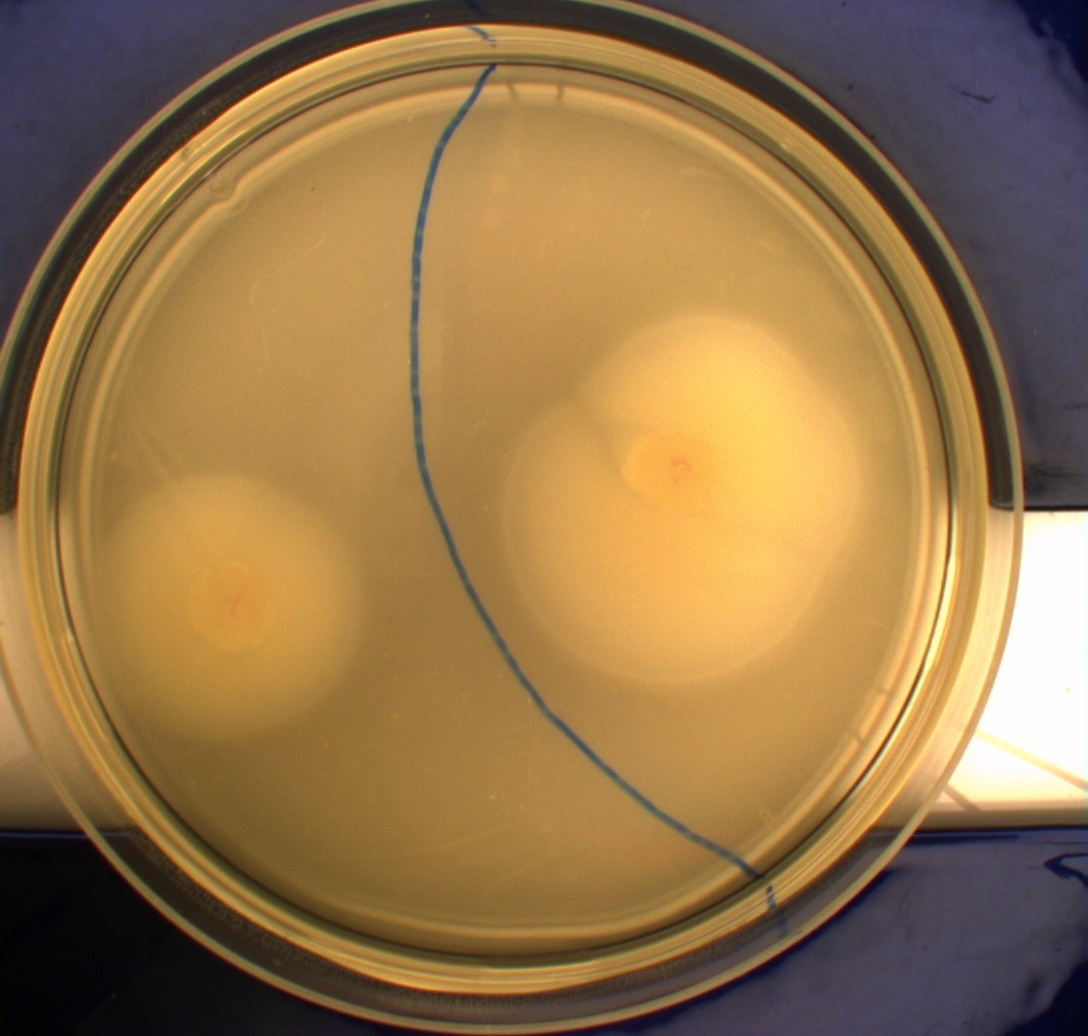
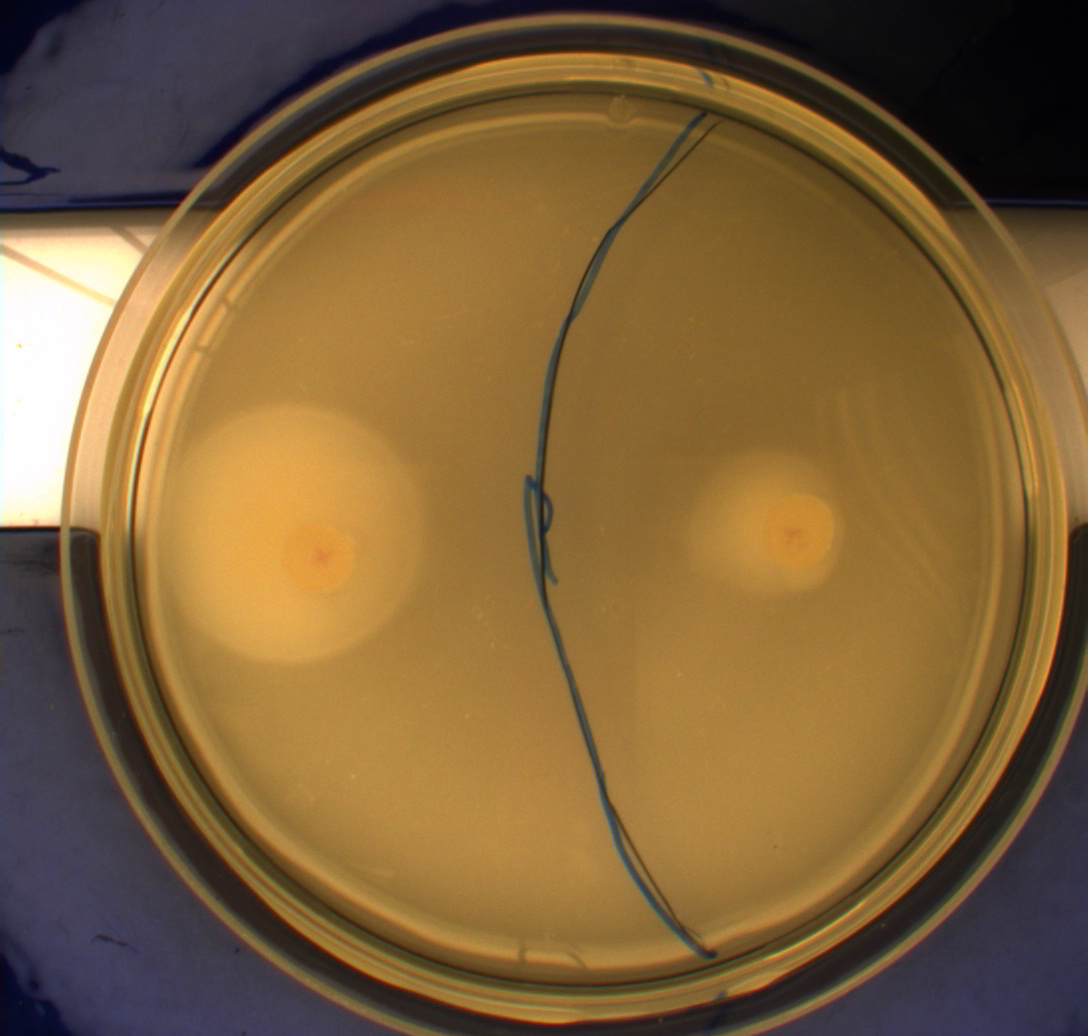
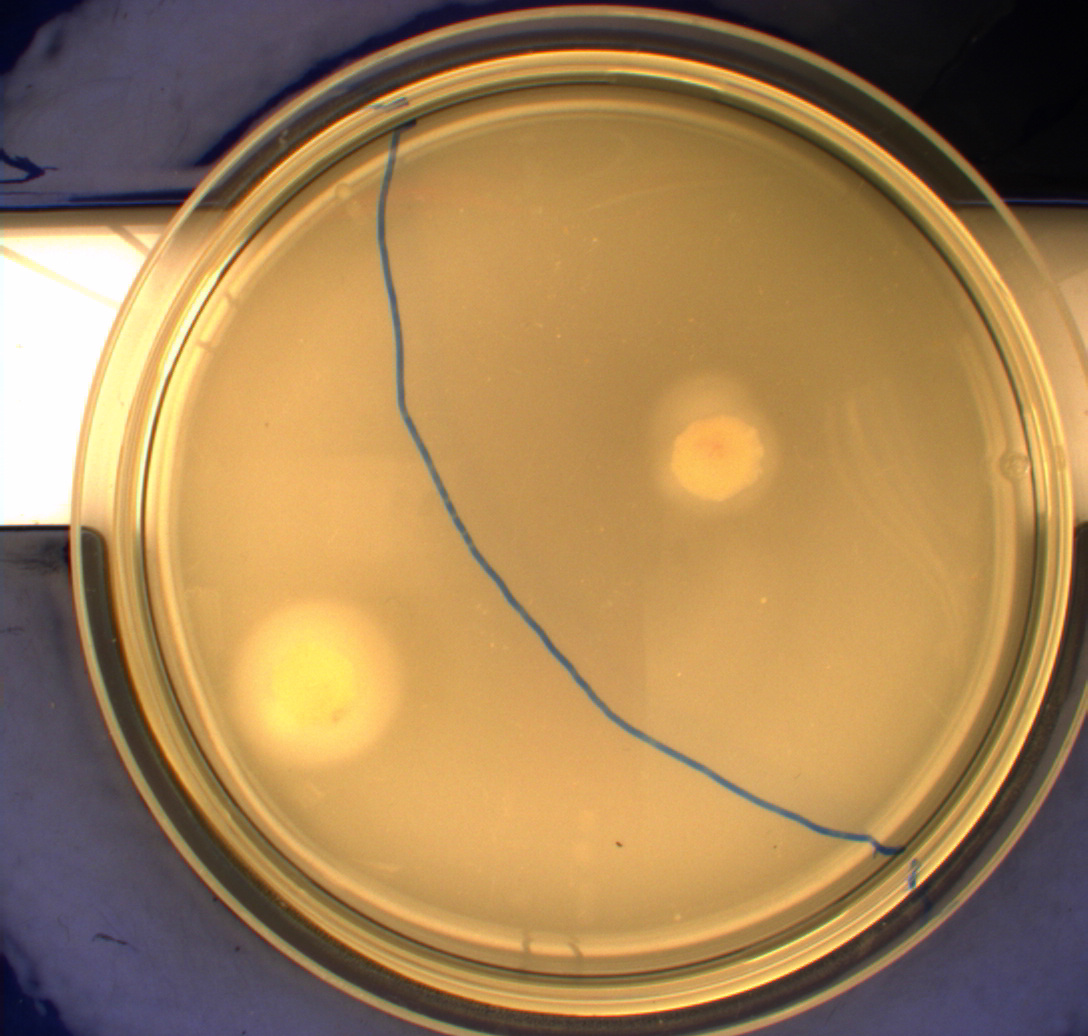
| + | [[Image:Team-SDU-denmarkBetacarotene_samples_with_controles_(exponential_phase).png |250px|thumb|Wildtype bacteria exposed to blue light]] | ||
In order assess the results a standard dilution of beta-carotene: 1mM, 100 µM, 50 µM, 25 µM, 10 µM, 5 µM, 1 µM, 100 nM and 10 nM. The standart dilutions was also measured on the spectrophotometer. The resulting graphs is presented beneath the text<br> | In order assess the results a standard dilution of beta-carotene: 1mM, 100 µM, 50 µM, 25 µM, 10 µM, 5 µM, 1 µM, 100 nM and 10 nM. The standart dilutions was also measured on the spectrophotometer. The resulting graphs is presented beneath the text<br> | ||
When combining the graphs of the samples and the standard dilutions it is possible to tell that the spectres are uniform. This indicates that it is Beta-carotene which is produced because of the similarity in the spectres. The graphs also indicate the amount of Beta-carotene produced by the MG1655 and the Top10 E. Coli cells. The resulting graphs is presented beneath the text<br> | When combining the graphs of the samples and the standard dilutions it is possible to tell that the spectres are uniform. This indicates that it is Beta-carotene which is produced because of the similarity in the spectres. The graphs also indicate the amount of Beta-carotene produced by the MG1655 and the Top10 E. Coli cells. The resulting graphs is presented beneath the text<br> | ||
| + | |||
Revision as of 10:38, 18 October 2010
 "
"
