Team:SDU-Denmark/project-p
From 2010.igem.org
(→Scanning Electron microscopy) |
(→Computerized analysis of the bacterial motility with the THOR prototype by Unisensor A/S and the Unify software) |
||
| Line 73: | Line 73: | ||
We started out with extracting the mean velocity in um/frame for the photosensor and wildtype bacteria when exposed red and blue light, the mean was extracted from around 100 paths for each of the 4 different samples (only taken from the experiment where we shifted between red and blue light, data from the light intensity and gradient experiment were not included.). What we hoped to see was that bacteria that tumble less would have a higher mean velocity, than bacteria that exhibit a normal rate of tumbling (the wildtype):<br> | We started out with extracting the mean velocity in um/frame for the photosensor and wildtype bacteria when exposed red and blue light, the mean was extracted from around 100 paths for each of the 4 different samples (only taken from the experiment where we shifted between red and blue light, data from the light intensity and gradient experiment were not included.). What we hoped to see was that bacteria that tumble less would have a higher mean velocity, than bacteria that exhibit a normal rate of tumbling (the wildtype):<br> | ||
[[Image:Red_blue_PS_noPS.jpg|750px|center]]<br> | [[Image:Red_blue_PS_noPS.jpg|750px|center]]<br> | ||
| - | Contrary to our expectations the plot over mean velocity/frame did not show a noticeable difference between the four samples. The photosensor had about the same velocity/frame in blue and red light and there was no clear difference either when compared to the wildtype. The reason for this could be that we were were not effective enough at excluding non-informative paths from the data file (bacteria that are trapped in a circular motion, bacteria only exhibiting brownian motion) and / or that the environment the experiments were done in, was not optimal in the meaning of that the photosensor was exposed to light, before the measurements. | + | Contrary to our expectations the plot over mean velocity/frame did not show a noticeable difference between the four samples. The photosensor had about the same velocity/frame in blue and red light and there was no clear difference either when compared to the wildtype. The reason for this could be that we were were not effective enough at excluding non-informative paths from the data file (bacteria that are trapped in a circular motion, bacteria only exhibiting brownian motion) and / or that the environment the experiments were done in, was not optimal in the meaning of that the photosensor was exposed to light, before the measurements.<br> |
| - | + | Since the results from the experiment with the red and blue light were inconclusive, we went on to analyse the data from the experiment, where we set up a light gradient in the area that was observed through the microscope. We recorded this for 40 seconds with a framerate of 4 frames/second, waited for 100 seconds and recorded again for 40 seconds. We did 10 iterations of this, which would give us a long-term overview of migration (if there is any) along the light gradient. | |
<br> | <br> | ||
Revision as of 18:20, 27 October 2010
Contents
|
Our Parts
<groupparts>iGEM010 SDU-Denmark</groupparts>
Characterization of parts
K343007
The part K343007 (from now on shortly called PS) is a generator for the SopII-HtrII photosensor from Natronomonas pharaonis coupled to E. Coli's chemotaxis pathway via the Salmonella enterica protein Tar. This part's effect on the system is to make E. Coli phototactic, so that it becomes aware of different light conditions. So for characterization of this part we made examination of motility and motility patterns our first priority and plasmid stability and growth of the cells our second.
There is a wide range of motility assays for chemotaxis in bacteria, this meant that we had a broad spectrum of experiments to choose from, which just had to be tweaked for making them suited for the analysis of phototaxis. The two experiments we chose for analysing the effect of this part (PS), were growth of the bacterial cultures in semi-solid agar and computer analysis of swimming motility through video microscopy:
Growth of bacterial culture on semi-solid agar plates
Experiment 1
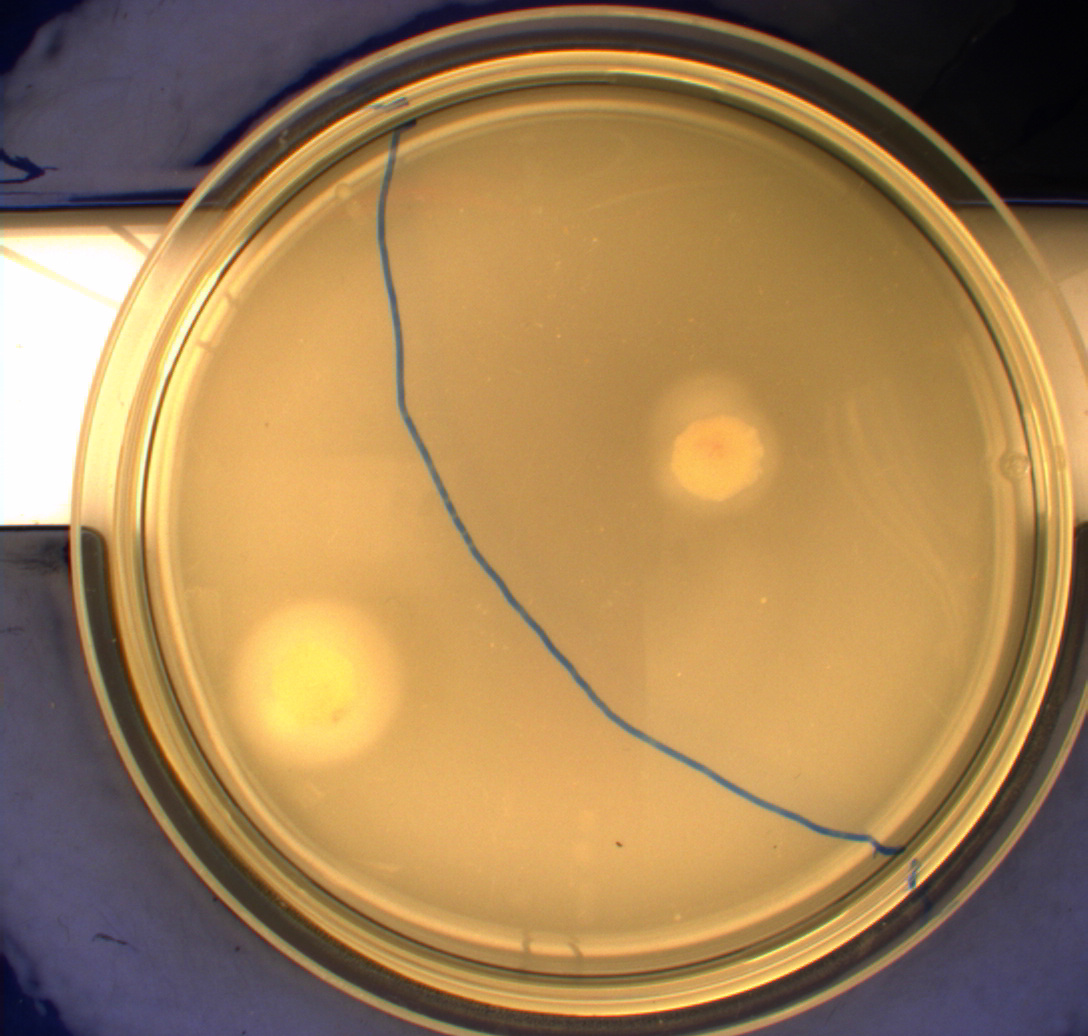
The bacteria and plates were prepared after our own protocol, which you can find here: PS1.1Since exposure to blue light should decrease the phototaxic bacterias tumbling frequency, the expected result was that the colony which was placed between the light and dark half of the plate would spread out in the darkness and would not move further when it reached the light. This is counter-intuitive, since decreased tumbling should lead to a longer distance traveled. What happens at the microscopic scale in semisolid agar is that the agar creates a matrix like structure where there are channels through the agar, which the bacteria can swim through. The decrease in tumbling frequency of the bacteria will make it harder for them to find the channels in the agar to swim through, which leads to them being trapped where they were placed. The result is that a colony which shows an increased run time, will look as if it it was non-motile on these plates [1]. Our results showed exactly this; the bacterial culture had spread out to on the dark half of the plate and did not get nearly as far on the half exposed to light. This experiment was done with a normal wildtype MG1655 and a non-motile strain of E.coli, DH5alpha, as controls. As expected these cells did not show anything like the behavior described above, which indicates that the effect stems from the modification to our photosensor bacteria.
These results were useable, but not fully conclusive, since there were some non-optimal conditions present in this experiment. We used ambient light instead of pure blue light, and the exposure to light for the multiple samples was not exactly even. Therefore we had to improve our experimental setup and see if we could reproduce these results with a more reliable setup.
Experiment 2
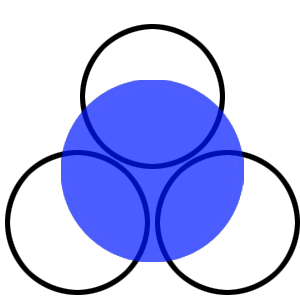
The experiment described above was repeated in a more controlled environment. This means that there were no changes as to how the plates or bacterial cultures were prepared, so we refer again to PS1.1 in regards to how this was done. The difference lies in the setup of the light-controlled environment. What we did this time was that the plates was illuminated from above by a single light source in an otherwise completely dark environment, we prepared a cut-out so that the light would only hit one half of our plates and the other half would remain in the dark. Since the problem with the last experiment was that the light source was just normal white light (which contains a lot of different wavelengths), this time around we used an optical filter so that only light with a wavelength of around 470nm could pass through, which resulted in a blue light shining down on the plates. The light-source itself was a run-of-the-mill flashlight, with a blue light filter installed in front of the lens. To eliminate the effect of temperature gradients inside the incubator, the three samples were placed in a triangle formation in the center of the incubator.
Another deviation from the protocol is that the culture was inoculated at the center of the plate, instead one colony each was inoculated in the center of the light exposed and dark half respectively. This would give us more information on how the bacteria would behave when directly exposed to either the dark or light surroundings, instead of the gradient that was present in the first experiment.
From the results of the first experiment we expected the culture containing K343007 to spread out in the dark and not to spread when exposed to light. The wildtype bacteria should spread out evenly no matter if exposed to light or not and the non-motile strain (DH5alpha) should not move regardless of the light conditions. Our expectations from the first experiment were fulfilled, as the bacteria behaved exactly as expected. This made it possible to conclude that the photosensor has an effect on the bacteria's tumbling frequency, but if it does in fact reduce the tumbling is not possible to say, since both an increased and reduced tumbling frequency will look alike.
From left to right: MG1655 (Wildtype), Photosensor (Bacteria containing K343007), DH5alpha (non-motile strain)
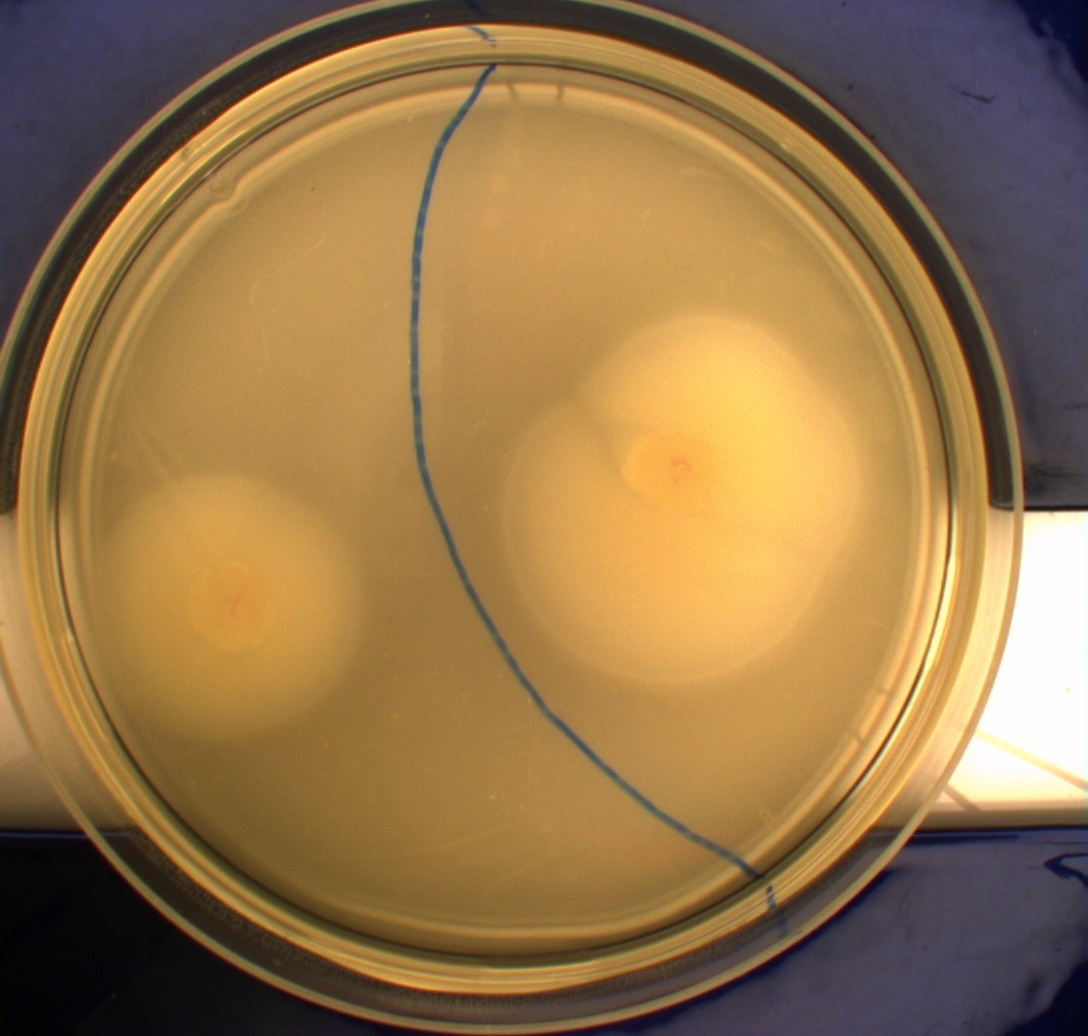
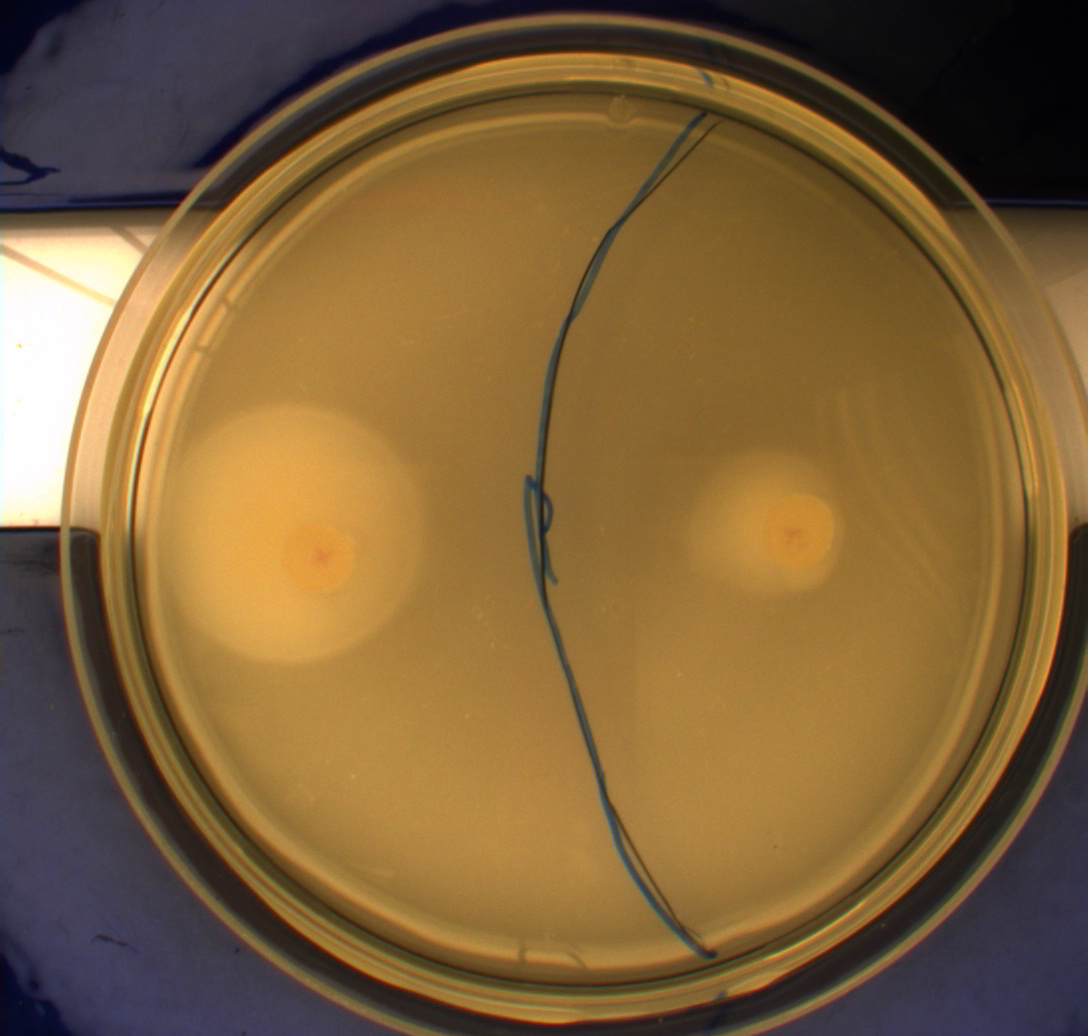
After this we could conclude that the part had an impact on the bacterial motility, but we had to find out which. This lead us to our next experiment, which was intended for determining what happened to the tumbling frequency:
Videomicroscopy and computer analysis of bacterial motility
To get an exact idea of what is happening to the bacteria when expressing the photosensor we decided on doing video microscopy of motile bacteria. The bacterial cultures were prepared acording to protocol PS1.1. Wildtype MG1655 and DH5alpha was used as controls.
The actual microscopy was done on a Nikon eclipse TE2000-S microscope with an optical magnification of 1000x.
To be able to observe an effect in the modified bacteria we had to expose the cultures to light, which was done through the microscope's integrated light source, which could switch between blue, green and ambient light. To ensure that the blue light was at the correct wavelength the same optical filter that was used for the plate experiments was inserted between the lightsource and the microscopy slide. Since microscopy is impossible without light, we had to use red light as a replacement for darkness, the source of the red light was ambient light from the microscope's light source filtered through a red optical filter (about 580nm). This should not have any effect on the phototactic bacteria according to [2]. The room where the experiment was carried out was kept as dark as possible, as to eliminate the chance of the phototactic bacteria being unwantedly exposed to light. The actual experiment was carried out in the following manner:
1. Expose bacteria to red light for 1 minute, while recording video.
2. Move to another spot on the slide, repeat 1. (repeated until 5 videos were recorded)
3. Expose bacteria to blue light for 1 minute, while recording video.
4. Wait for 30 seconds, for the bacteria to reset themselves.
5. Move the focus to another spot on the slide, repeat 3. (x5)
This was done with all three strains of bacteria.
An example of the results:
When played at real time speed these videos seem slow and not showing any tendency, though when played at 4 times the normal speed, the photosensor will seem to show slightly increased motility when exposed to blue light. Even though the bacteria displayed disappointing motility, we went on and did computer analysis on the videos by the help of the open source software "CellTrack". The paths that were mapped showed a longer traveling distance for the bacteria expressing the photosensor compared to the rest of the samples when exposed to blue light. We picked 10 bacteria from each sample, which amounts to 60 bacteria that were tracked. This is a rather small amount, but because of the time-intensive procedure a more thorough data analysis was not possible.
Samples of the tracked paths (from left to right): Photosensor exposed to blue light, photosensor exposed to red light, wildtype exposed to blue light.
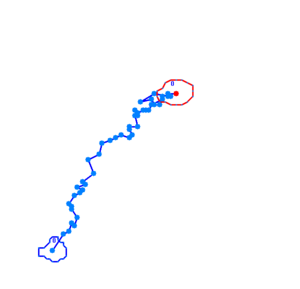
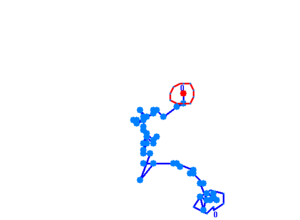
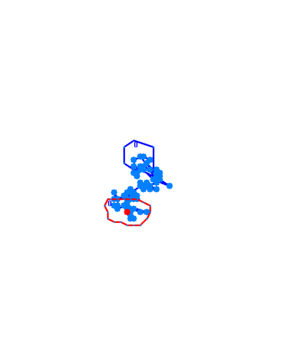
This might indicate a decreased tumbling frequency, but the low motility of the bacteria, the inadequacy of the cell track software and the small amount of data analysed make results of this experiment unreliable and a new protocol had to be devised.
Computerized analysis of the bacterial motility with the THOR prototype by Unisensor A/S and the Unify software
For this experiment we changed our protocol for cultivating swimming bacteria in order to optimize their mobility PS1.2
The machine and software used for the analysis are prototypes and still under heavy development. Because of trade secrets it is impossible for us to explain how the machine works or give a detailed explanation of it's mechanism until the THOR has reached production status. Simplistically said it is a very advanced video microscope, with which it is possible to analyse liquids and the particles inside those in both 2D and 3D, while also tracking them over time and also space, since the camera/optical lens can also move along the slide, while recording.
2.5 ul of the bacterial dilution were placed on the center of the microscopy slide and covered by a cover slip, which results in a layer of liquid with a height of 6 um. Afterwards the sample was sealed with mineral oil as to prevent a flow in the liquid. The data collection was done exactly as described in the previous experiment, with the exception that we diodes instead of optical filters. The light used for recording was a red LED diode with a wavelength of 660 nm. The lightsource used for the exposure was a bluelight LED, which emitted light at a wavelength of 470 nm, which hit the sample with an angle of attack of 17°. Moreover we also recorded the bacteria's behaviour when exposed to a blue light gradient and varying intensities of light measured in milliampere ranging from 1 mA to 20 mA. All the measurements were carried out on the modified phototactic bacteria and the wildtype MG1655 as a control.
The resulting videos looked like these examples:
The bacteria that are not moving in the video are assumed to be sticking to the glass or coverslip.
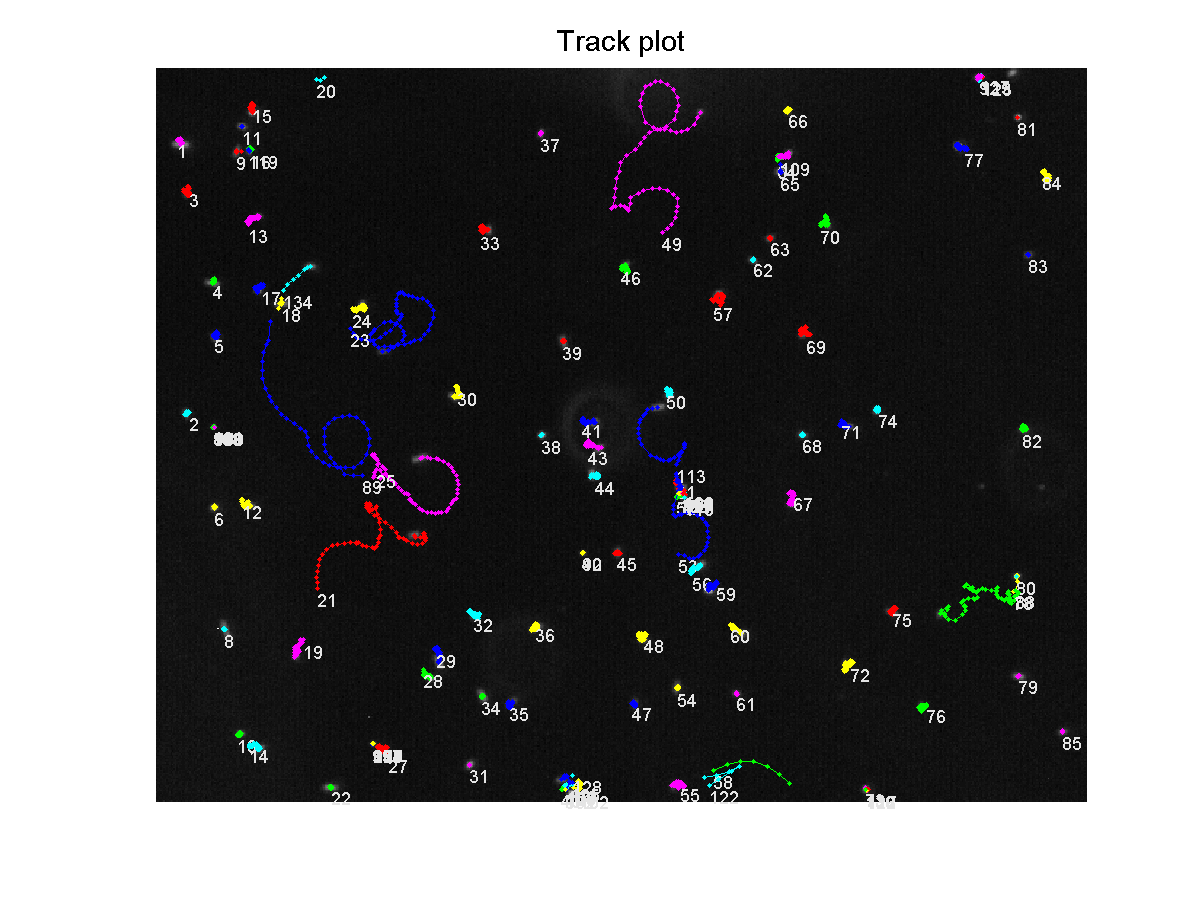
From these videos we extracted data through Unisensor's in-house programmed software Unify and it's tracking extension. For each frame the bacteria were identified and their location compared to that of the frame before it and by thta, tracking the bacteria over time. The resulting data that was output for each frame was: Location of bacteria given as coordinates (X,Y), bacterial orientation in angle ranging from -180° to 180° and length of the path was tracked in pixels.
Here is an example of a .txt file containing the results: Tracks of wildtype bacteria exposed to red light. If interested, please request the whole dataset from us, which will be sent out as a 450mb zip file.
From this file, a trackplot was generated, showing each bacteria's path over the recorded time:
We started out with extracting the mean velocity in um/frame for the photosensor and wildtype bacteria when exposed red and blue light, the mean was extracted from around 100 paths for each of the 4 different samples (only taken from the experiment where we shifted between red and blue light, data from the light intensity and gradient experiment were not included.). What we hoped to see was that bacteria that tumble less would have a higher mean velocity, than bacteria that exhibit a normal rate of tumbling (the wildtype):
Contrary to our expectations the plot over mean velocity/frame did not show a noticeable difference between the four samples. The photosensor had about the same velocity/frame in blue and red light and there was no clear difference either when compared to the wildtype. The reason for this could be that we were were not effective enough at excluding non-informative paths from the data file (bacteria that are trapped in a circular motion, bacteria only exhibiting brownian motion) and / or that the environment the experiments were done in, was not optimal in the meaning of that the photosensor was exposed to light, before the measurements.
Since the results from the experiment with the red and blue light were inconclusive, we went on to analyse the data from the experiment, where we set up a light gradient in the area that was observed through the microscope. We recorded this for 40 seconds with a framerate of 4 frames/second, waited for 100 seconds and recorded again for 40 seconds. We did 10 iterations of this, which would give us a long-term overview of migration (if there is any) along the light gradient.
Stability assay
To determine the stability of our pSB1C3-K343007 plasmid, a stability experiment was carried out according to protocol[SA1.1]. E.coli MG1655/pSB1C3-K343007 was grown in LB media without chloramphenicol, whereby no selection pressure is exerted on the bacteria. Dilutions of the culture was spread on LA plates and LA plates with 35ug/mL chloramphenicol, respectively, and the colony forming units (cfu) was determined for each plate. The cfu for the LA plates represents the total amount of bacteria in the culture, and the cfu of LA plates with chloramphenicol corresponds to the amount of plasmid carrying bacteria. The percentage of the total amount of bacteria carrying the plasmid was plotted in a semi-logarithmic graph as a function of number of generations.
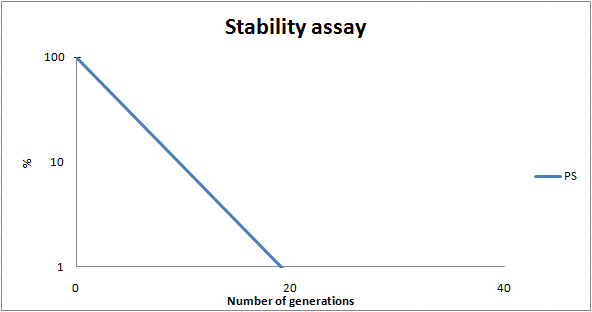
As seen in the graph, almost all of the bacteria had shed the plasmid after 20 generations, suggesting that the plasmid is only stable within the cell for a few generations (<20). This is presumably due to the strain brought upon the bacteria by the plasmid. Thereby when the bacteria are carrying a high-copy plasmid like pSB1C3-K343007 it is plausible that the bacteria will quickly shed the plasmid when no longer exposed to a selection pressure.
It is likely to believe that pSB3C5-K343007, since being a low-copy plasmid, will not exert as much strain on the bacteria, and might therefore be stable for more generations than pSB1C3-K343007. Therefore a stability assay of this plasmid might be of interest.
Growth assay
The purpose of this assay is to see if our transformants deviate from the wild type in growth rate. In the growth measurement assay we have measured OD at 550 nm every hour for 12 hours and at hour 24. In the experimental setup we used no lag phase was observed in any of the measurements.
The graph below shows the growth of our wild type E. coli strain MG1655, the MG1655/pSB3T5-K343007 and MG1655/pSB1C3-K343007 respectively.

From our data we see no significant difference between the plasmid carrying bacteria and the wild type. This can be said to be quite conteradictory to our results obtained from the stability assay. The transitory stability of pSB1C3-K343007 suggests that it is highly unfavorable for the bacteria, wherefore it might be expected that the growth of the bacteria containg this plasmid would be affected. Thus, however much a disadvantage the plasmid pose to the bacteria, their growth are not significantly influenced by the plasmid. The added reproduction load due to the plasmids, might also prolong the lag phase of the bacteria. Whether this is the case can not be concluded based on this experiment as no lag phase was observed in this experiment.
K343004
The FlhDC operon is the master regulator of flagella synthesis. A more detailed description of the operon can be found here
In our system the purpose of the composite part is to hyper flagellate our cells so that a grater force can be generated in the microtubes. The FlhDC operon is naturally found in the E. coli strain MG1655 genome. We extracted the operon and inserted a silent mutation (T to C) at position 822 in the operon because without the mutation this site is a Pst1 digestion site and it would therefor constitute problems when assembling the composit part.
We have made three FlhDC parts:
K343100 is the coding sequence of the native FlhDC operon with the Pst1 digestion site
K343000 is the coding sequence of the mutated FlhDC operon
K343004 is the composite part containing the TetR repressable promoter (constitutive when no TetR is pressent) + RBS (J13002), the K343000 part and the double terminator (B0015).
The composite part is caracterized firstly by using a motility assay and secondly by measuring plasmid stability and cell growth.
Motility assay
The purpose of this experiment is to test the motility of the transformed cells containing either pSB1C3-K343004 or pSB3K3-K343004. We also want to test if it makes a difference in the motility whether the bacteria contain low-medium- or high-copy plasmids.
For the motility assays we added 5ul of an ON culture to petridishes containing motility agar (LB media with 0.3% agar) instead of regular LA (Luria agar). This semi-solid media lets the bacteria swim more easily.
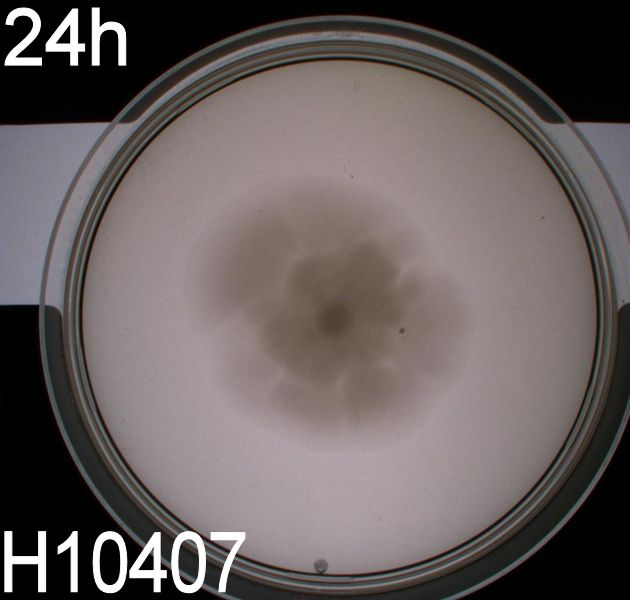
In the assays three control plates were made: A negative control containing E. coli strain DH5alpha which does not express flagella and therefore movement in the media should be minimal. A positive control containing E. coli strain H10407 which is a hyper flagellated class II pathogen, these bacteria should show high motility. And a wild type E. coli strain MG1655 that has about 4 flagella per cell these cells would be expected to move farther than the DH5alpha but not as far as the positive control.
The plates were incubated at 37 degrees celcius for up to 48 hours.
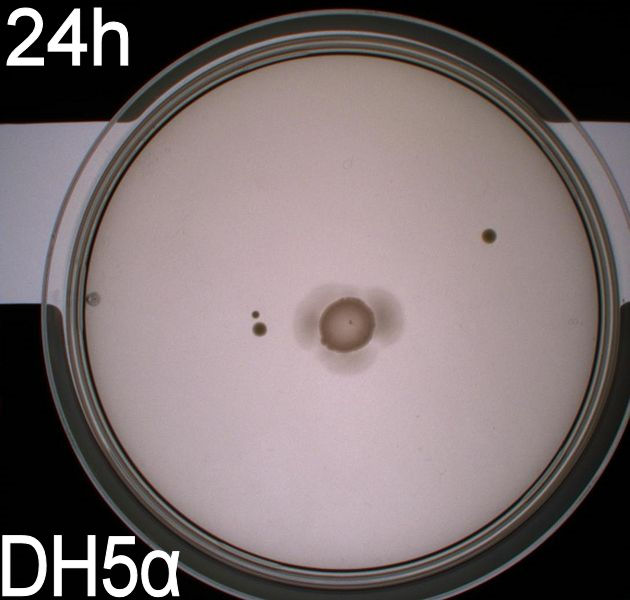
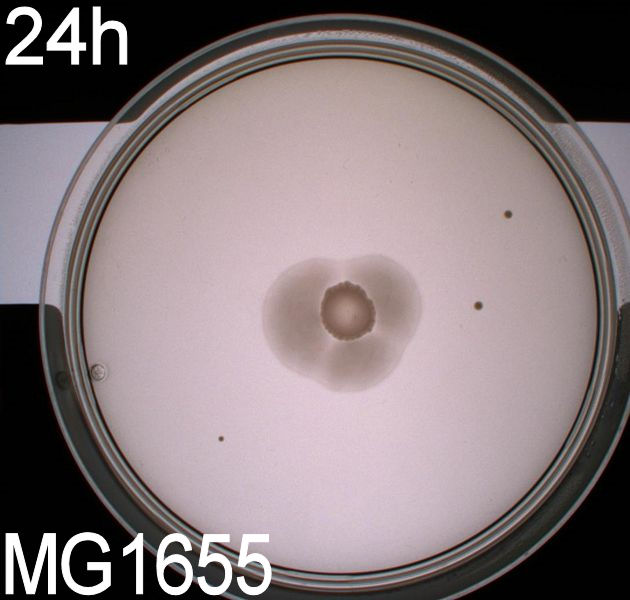
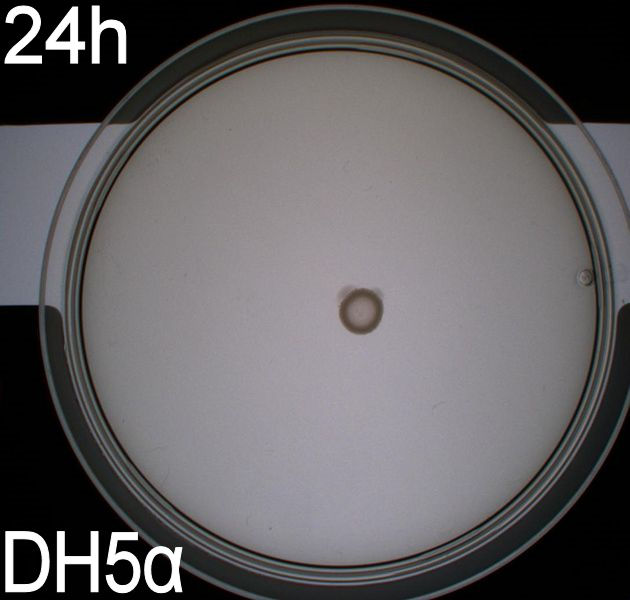
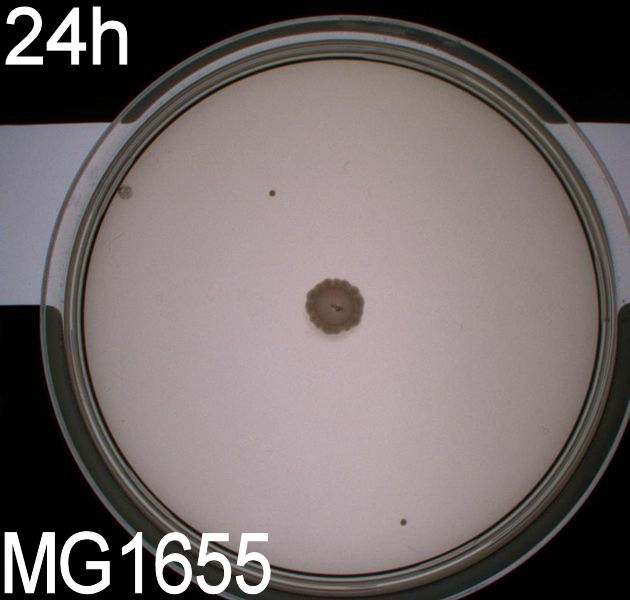
The assay was carried out three times. All three times pictures were taken after 24 hours and in two of the assays pictures were also taken after 48 hours. In two of the assays 8.5 cm petridishes was used, the purpose of these assays was to se if the motility of our transformants differed from the control strains. In the third assay we used 13.5 cm petridishes to oberserve the transformants swimming ability compaired to the wild type E. coli strain MG1655 since the motility of the transformed cells seem to surpass the size of the 8.5 cm petri dishes.
All the pictures taken after 24 hours are shown in the last part of this section while the pictures taken after 48 hours are shown and described.
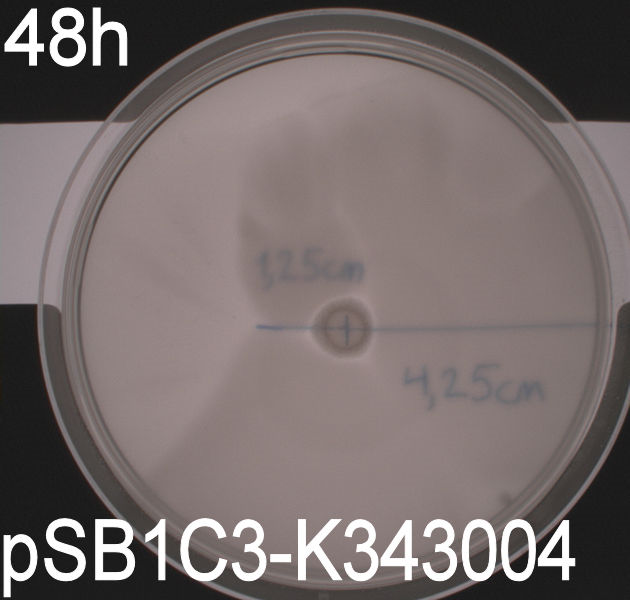
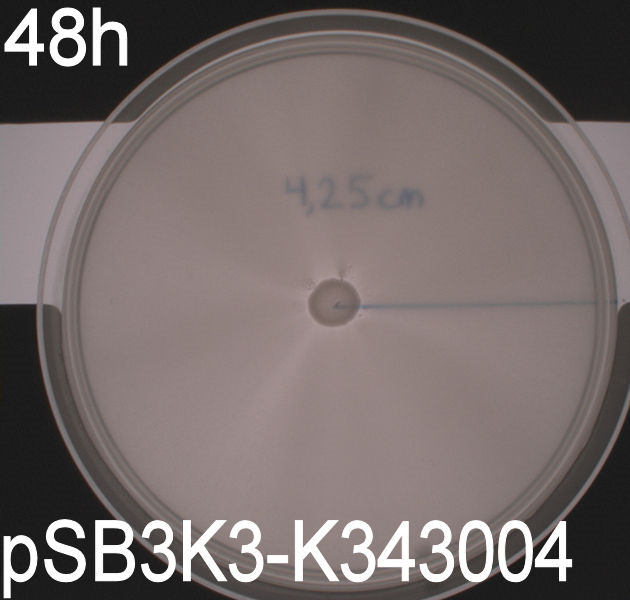
WT, negative- and positive-control after 48 hours:
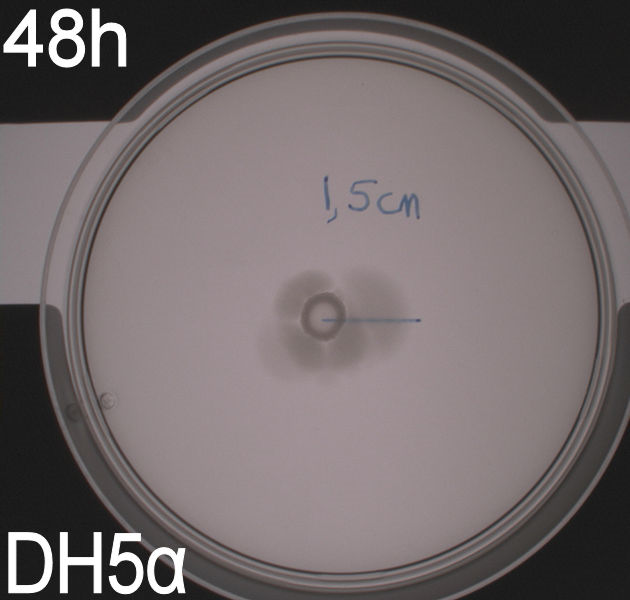
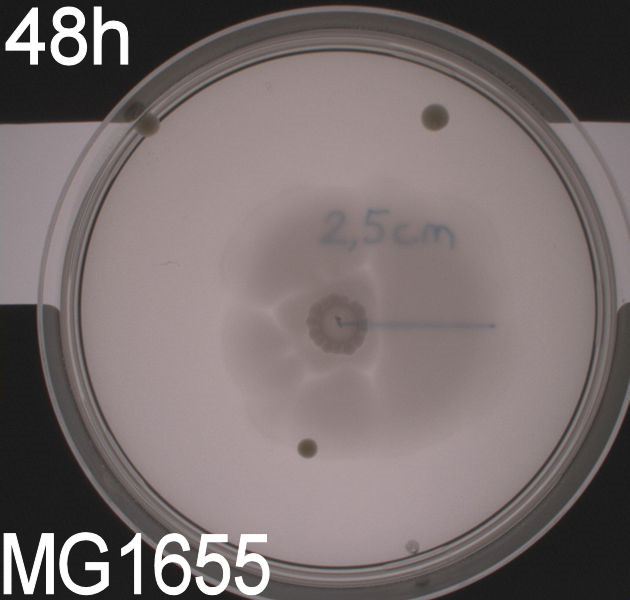
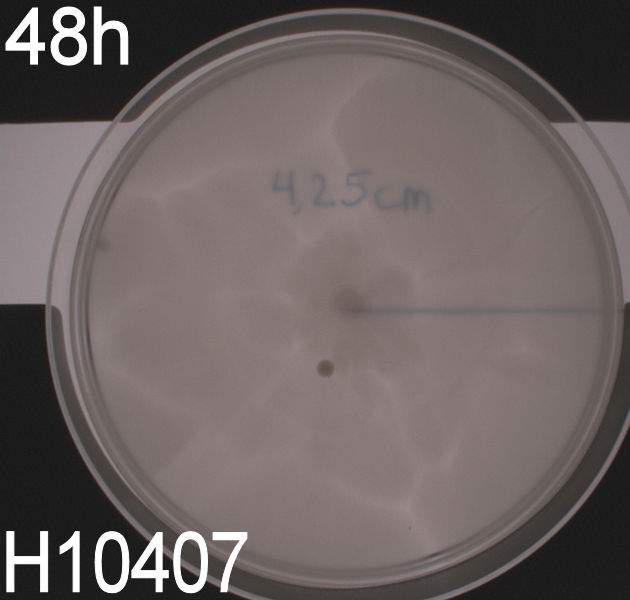
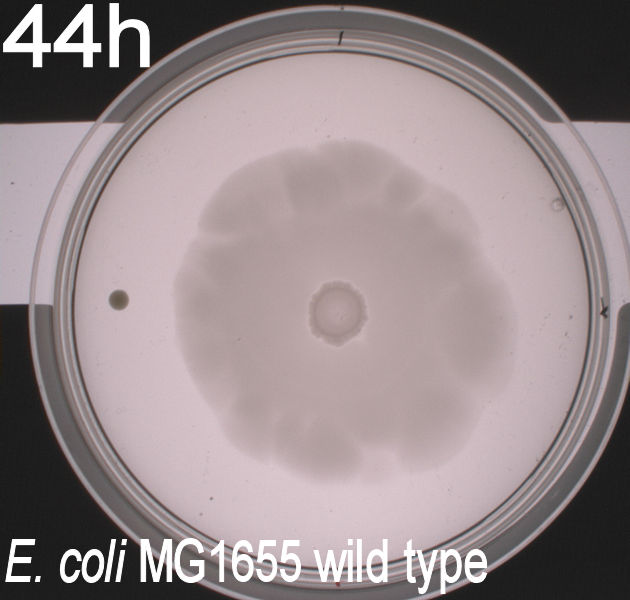
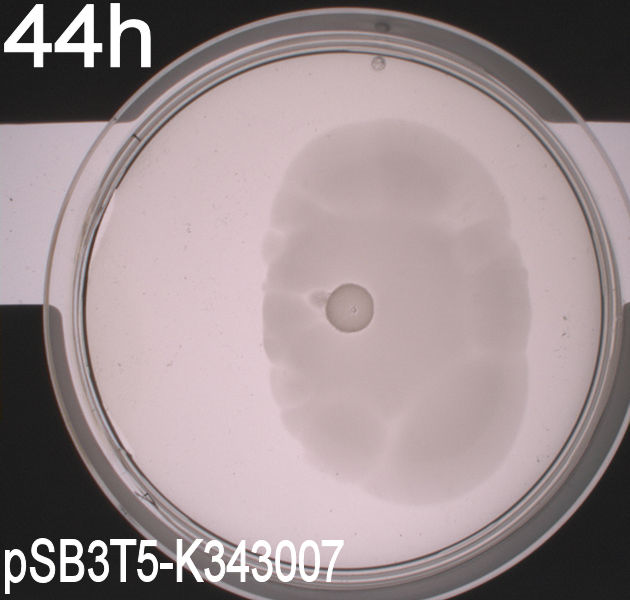
In all three assays we saw that the control plates containing no antibiotics were contaminated with other bacterial colonies. We also saw that the negative control has low motility but they are not immotile. After 24 hours the negative control has not moved much but after 48 hours the length from center to edge of the colony is 1.5cm. The wild type has moved a bit farther than the negative control after 24 hours and after 48 hours the difference from center to edge of the wild type is 2.5cm. The positive control moved about as far in 24 hours as the wild type did in 48 which and after 48 hours it had moved to the edges of the petridish (4.25cm). this was as expected because of their hyper flagellation.
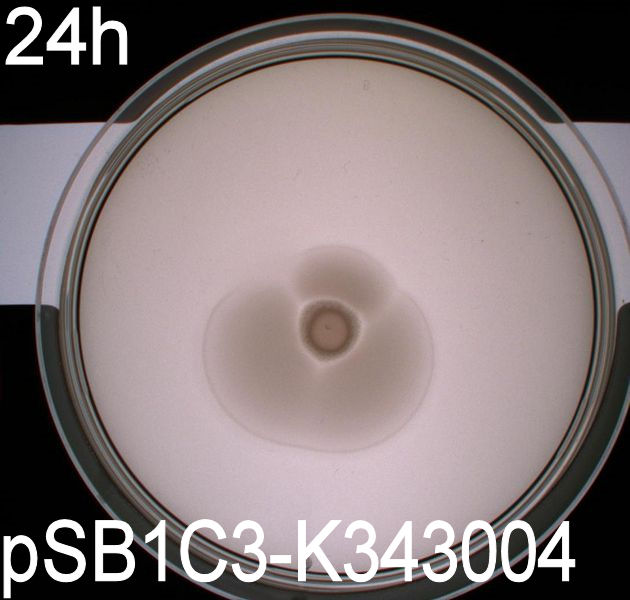
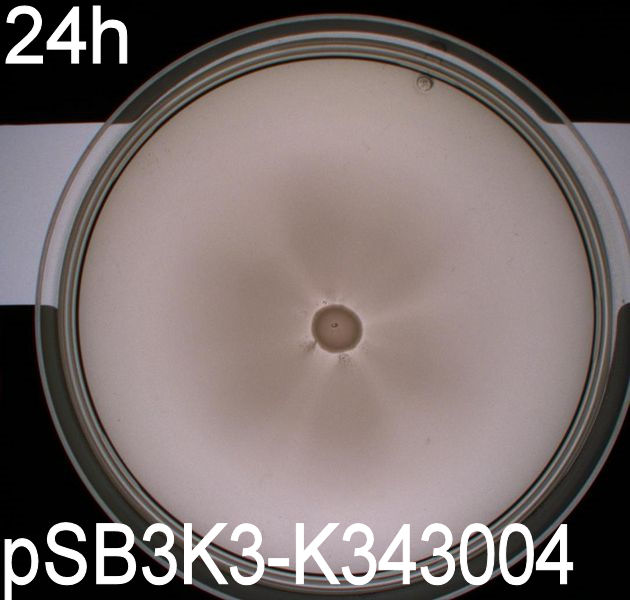
The E. Coli strain MG1655 cells transformed with pSB1C3-K343004 shows that after 24 hours these bacteria have moved farther than the wild type and the negative control. The E. coli strain MG1655/pSB3K3-K343004 have moved farthest of all 5 cultures after 24 hours. This mortility pathern are observed in all three assays. The cells containing the pSB3K3 plasmid show a uniform circle whereas the cells transformed with the pSB1C3 plasmid shows a budding-pattern spreading from the center. After 48 hours the pSB1C3 cells are still not covering the entire plate.
Pictures of plates after 24 hours
Experiment 1.

Experiment 2.
Conclusion
From the pictures above we can see that the bacteria containing our part is much more motile than the wild type and the negative control. We assume this is caused by overexpression of the FlhDC master flagella operon which leads to hyperflagellation of the cells.
The pictures taken after 24 hours show that bacteria with pSB1C3-K343004 have not moved as far as the bacteria containing pSB3K3-K343004. pSB1C3 is a high copy plasmid while pSB3K3 is a low-medium copy plasmid. The promoter in K343004 is a constitutive promoter (tetR repressable promoter). Bacteria containing a high copy plasmid with a constitutive promoter are more metabolically challanged than bacteria containing a low- or medium-copy plasmid with a constitutive promoter because of the higher number of plasmids per the cell. Therefore the high copy plasmid bacteria move slower than low- or medium-copy plasmid bacteria. However, after 48 hours there was only a small different in the bacterias migration.
Flagella staining
When the E.coli strain MG1655 are transformed with pSB1C3-K343004 an increased flagella production is expected. The idea was to get a quantitative measurement of the increased flagella production by comparing the observed number flagella on the wild type MG1655 and the transformant. We tried to stain the flagella using silver staining and afterwards examined the bacteria under the microscope. The staining procedure was started before the composite part, K343004, was finished so that we could optimize the staining protocol and become really good at staining the flagella. We started with staining of DH5α and H10407; A E.coli strain which do not express flagella (negative control) and a hyperflagellated E.coli (positive control), respectively. The bacteria were grown on agar plates ON and stained with this protocol FS1.2.
Unfortunately it was not possible to see a clear and significant difference between the positive and negative control. Though at some places it could look like flagella on the positive control but it was never enough to determine a difference. After repeating the protocol four times, each time with multiple samples, we decided to reject this method, and another approach for characterizing our biobrick was employed.
Scanning Electron microscopy
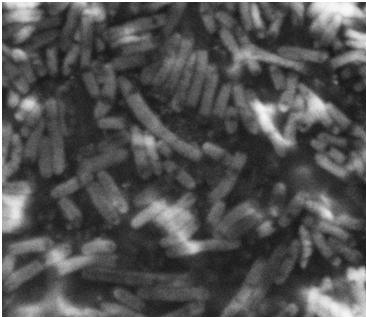
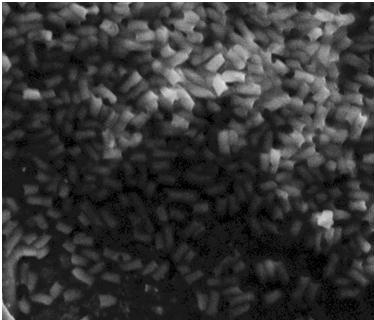
After the failed staning of the flagella we tried to visualize the flagella with scanning electron microscopy (SEM). The bacteria were grown ON in liquid cultures (5 ml LB-media). The bacteria were diluted to approximately 10^6 cells pr 10 µl solution. At that time we did not have our K343004 composite part so therefore we only tried SEM with the negative control strain DH5alpa and wild type MG1655. We did this as a preliminary work so we would be ready to do microscopy on the MG1655 cells containing the composite part when it was ready. Unfortunately the limited resolution and magnitude of the SEM at our disposal made it practically impossible to visualize any flagella in the microscope. Thus if this approach is to be used for characterization, a SEM of higher magnitude and resolution is required.
The pictures below are SEM pictures the negative control strain DH5alpha and wild type MG1655.
br>
Stability assay
To dertermine the stability of our pSB1C3-K343004 plasmid, a stability experiment was carried out according to protocol[SA1.1]. E.coli MG1655/pSB1C3-K343004 was grown in LB media without chloramphenicol, whereby no selection pressure is excerted on the bacteria. Dilutions of the culture was spreaded on LA plates and LA plates with 35ug/mL chloramphenicol, respectively, and the colony forming units (cfu) was determined for each plate. The cfu for the LA plates represents the total amount of bacteria in the culture, and the cfu of LA plates with chloraphenicol corresponds to the amount of plasmid carrying bacteria. The percentage of the total amount of bacteria carrying the plasmid was plotted in a semi-logarithmic graph as a function of number of generation.
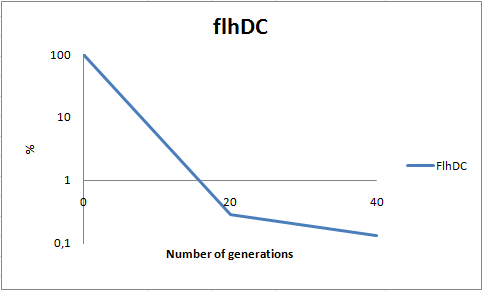
As seen in the graph, almost all of the bacteria had shedded the plasmid after 20 generations, suggesting that the plasmid is only stable within the cell for a few generations (<20). This is presumably due to the strain brought upon the bacteria by the plasmid. Thereby when the bacteria are carrying a high-copy plasmid like pSB1C3-K343004 it is to expect that the bacteria will quickly shed the plasmid when no longer exposed to a selection pressure.
It is likely to believe that pSB3C5-K343004, since being a low-copy plasmid, will not excert as much strain on the bacteria, and might therefore be stable for more genrations than pSB1C3-K343004. Therefore a stability assay of this plasmid might be of interest.
Growth assay
The purpose of this assay is to see if our transformants deviate from the wild type in growth rate. In the growth measurement assay we have measured OD at 550 nm every hour for 12 hours and at hour 24. In the experimental set-up we used no lag phase was observed in any of the measurements.
The graph below shows the growth of our wild type E. coli strain MG1655, the MG1655/pSB3K3-K343004 and MG1655/pSB1C3-K343004 respectively.

From our data we see no significant difference between the plasmid carrying bacteria and the wild type. This can be said to be quite contradictory to our results obtained from the stability assay. The transitory stability of pSB1C3-K343004 suggests that it is highly unfavourable for the bacteria, wherefore it might be expected that the growth of the bacteria congaing this plasmid would be affected. Thus, however much a disadvantage the plasmid pose to the bacteria, their growth are not significantly influenced by the plasmid. The added reproduction load due to the plasmids, might also prolong the lag phase of the bacteria. Whether this is the case can not be concluded based on this experiment as no lag phase was observed in this experiment.
Phase contrast of ON cultures
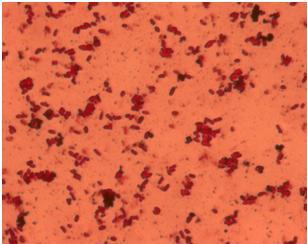
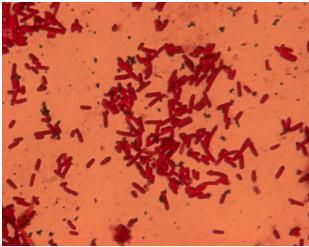
The purpose of the phase contrast microscopy is to see if the transformants are visibly different from the wild type. Since the FlhDC operon is not only an important part of the flagella synthesis but is also coupled to cell metabolism [3], it might be possible to see difference in morphology caused by an alterations in the cell cycle.
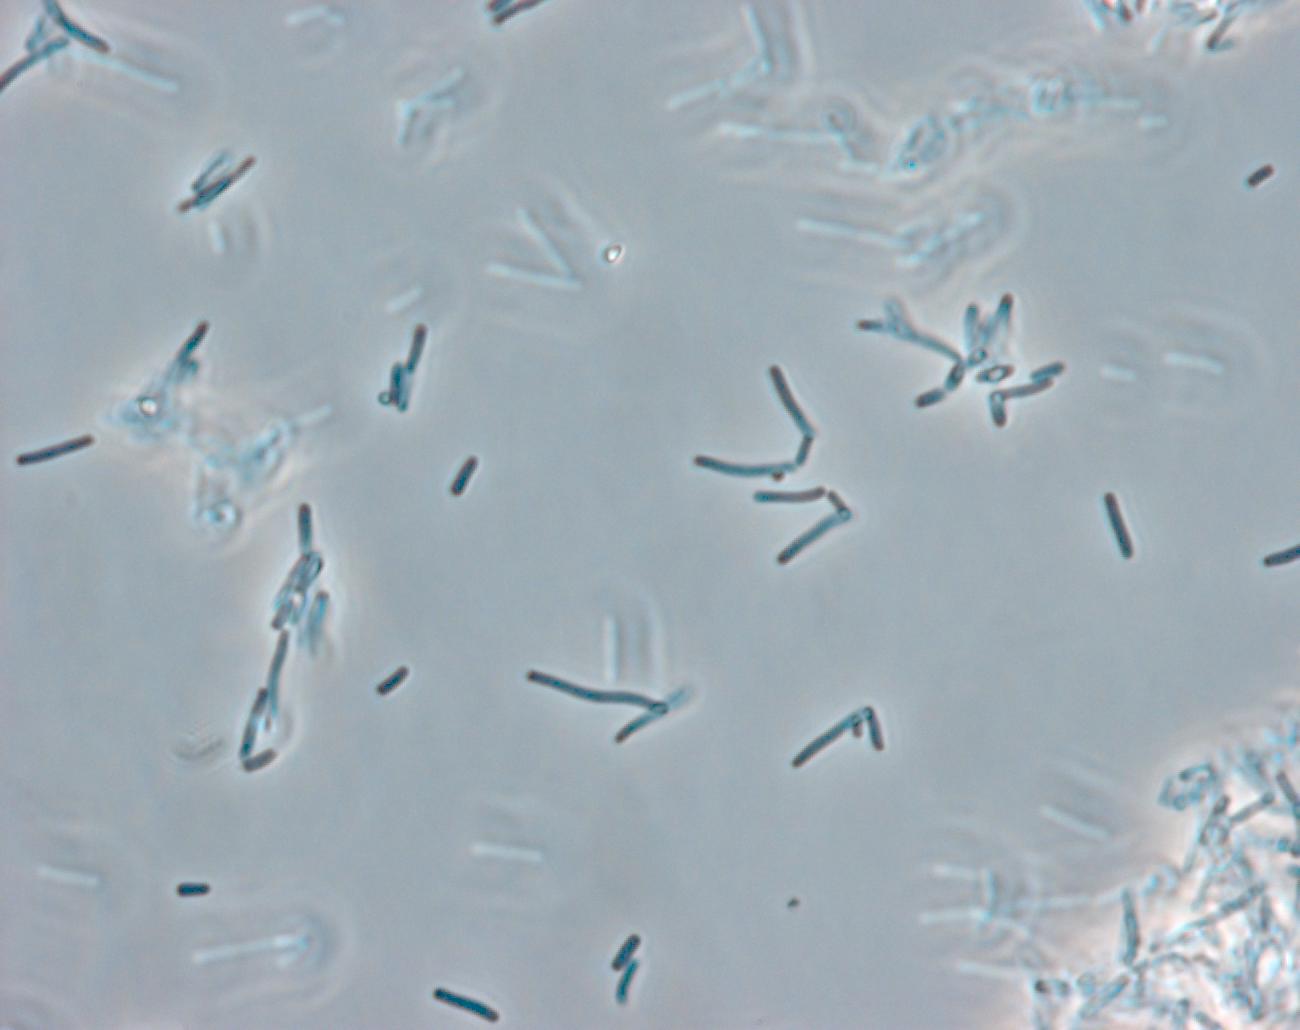
Phase contrast pictures were taken of wild type MG1655, MG1655/pSB1C3-K343004 and MG1655/pSB3K3-K343004.
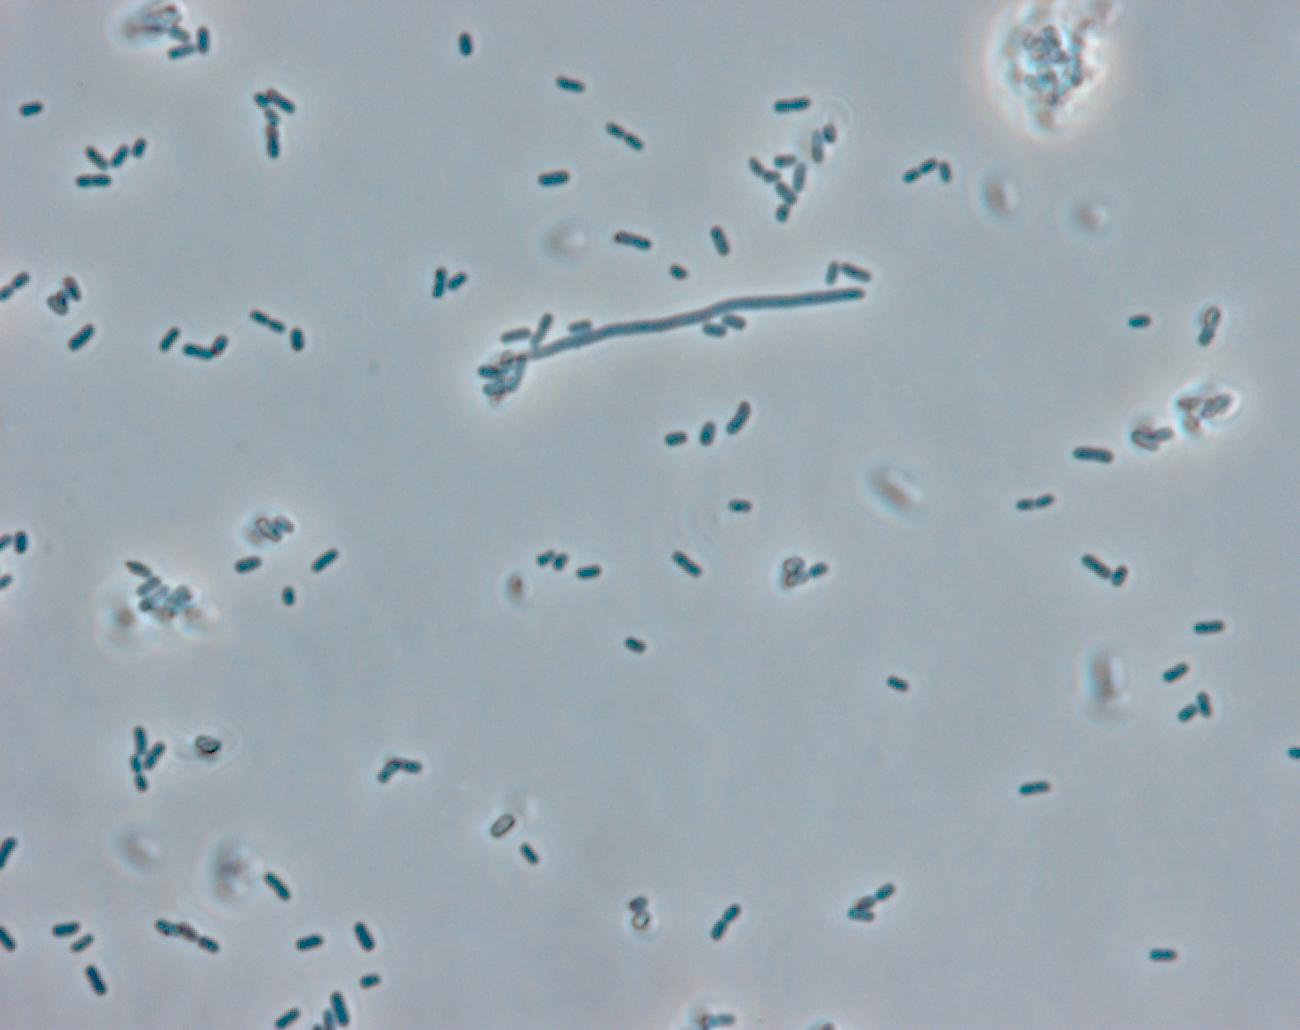
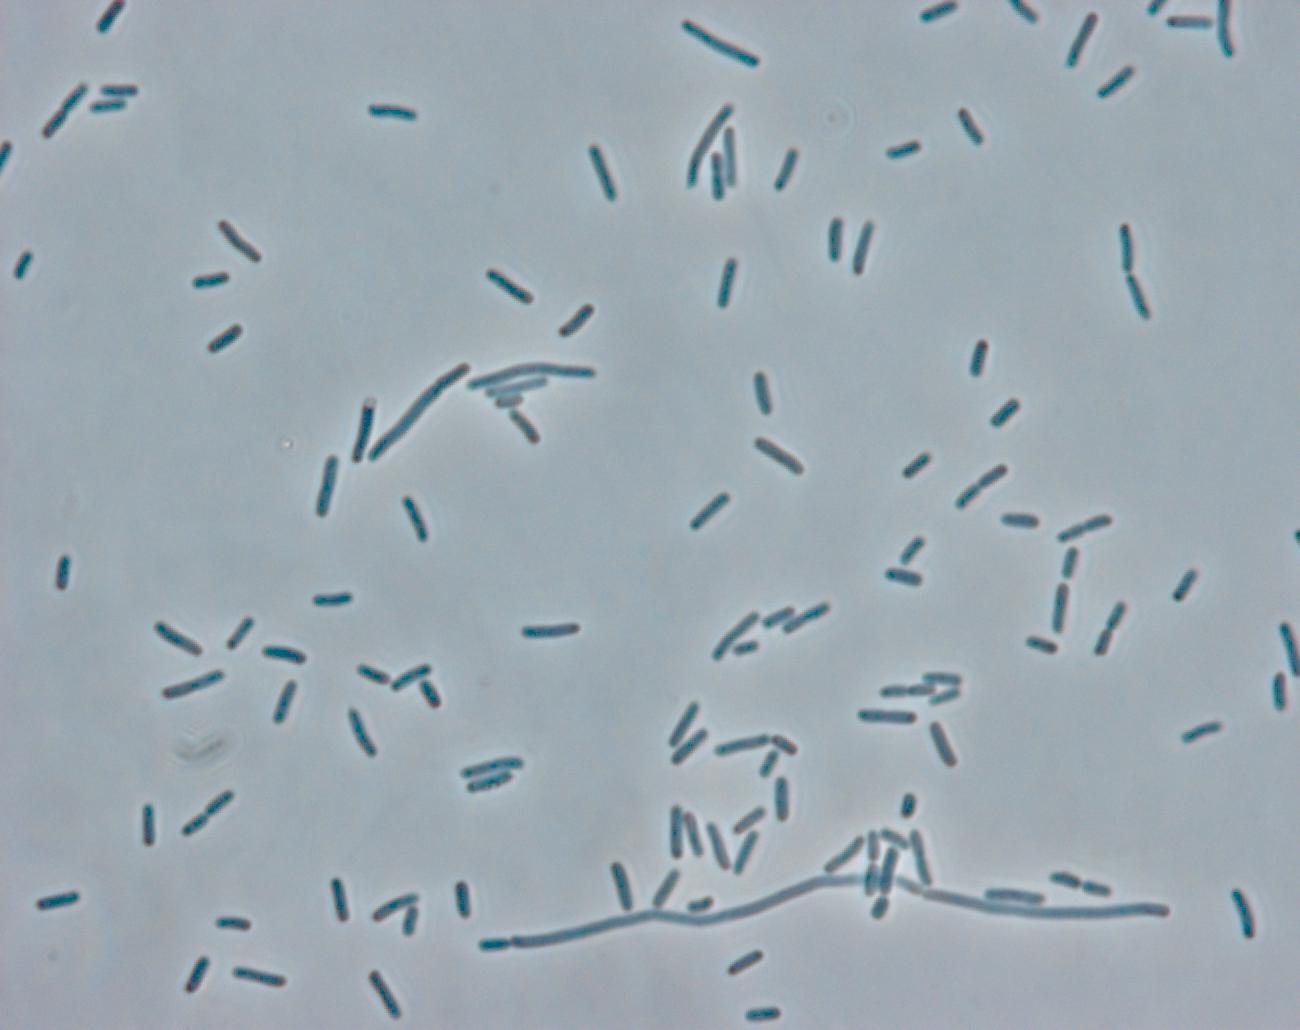
The pictures clearly show a difference in morphology of the wild type (picture 1) and the two transformants (picture 2-pSB1C3 and 3-pSB3K3). The wild type cells are small cells, while the transformants are obviously larger, which indicates a lower metabolism of the transformants. Cells with impaired metabolism divide slower and are larger than cells with normal metabolism (wild type), since it takes the impaired cells longer to reach the mitotic phase of the cell cycle.
K343005
UV-Vis determination of beta-carotene and retinal production
Seeing as both beta-carotene and retinal have unique and characteristic spectres when studied by UV-vis spectrometry. The spectra can be obtained by harvesting beta-carotene- and retinal-producing cells, re-suspending them in acetone and lysing them, which we chose to do by sonication. Afterwards, the cell debris can be pelleted and the supernatant can be examinated.
The acetone suspension of beta-carotene and retinal can then be subjected to spectrophotometry, and the obtained values and spectra can be compared to those of pure beta-carotene or retinal in known concentrations. This method provides both a qualitative answer to whether or not the desired compound is present and a qualitative indication of the concentration in the cells.
In this experiment cells were prepared and harvested according to protocol EX1.1. This experiment was performed with six different strains of E. coli:
Wild type TOP10
Wild type MG1655
TOP10-pSB1A2-K274210
MG1655-pSB1A2-K274210
TOP10-pSB1A2-K274210/pSB1C3-K343005 (double transformants)
MG1655-pSB1A2-K274210/pSB1C3-K343005 (double transformants)
Both K343005 and K274210 were constitutively expressed.
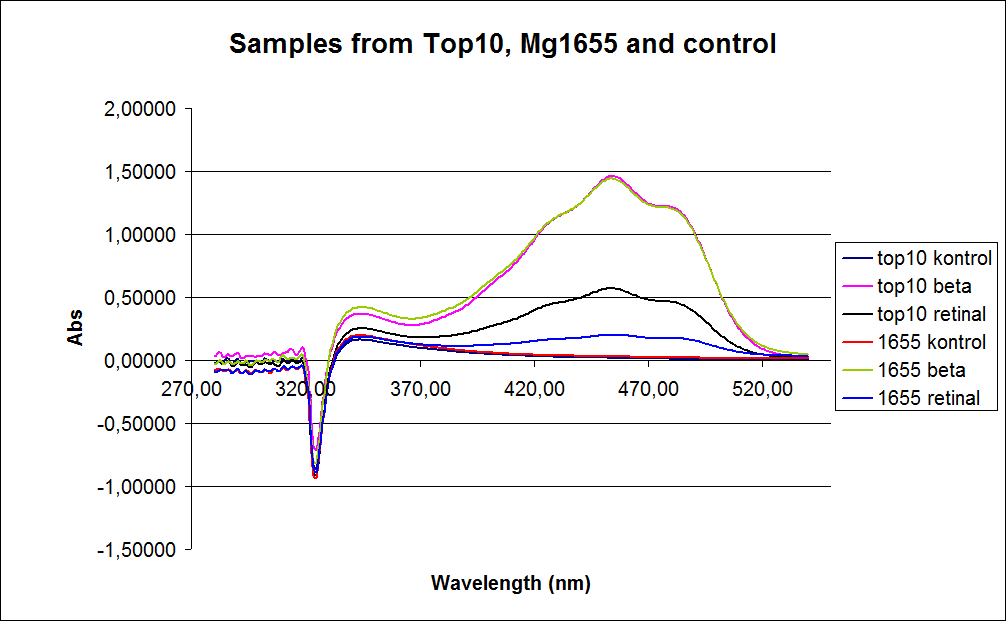
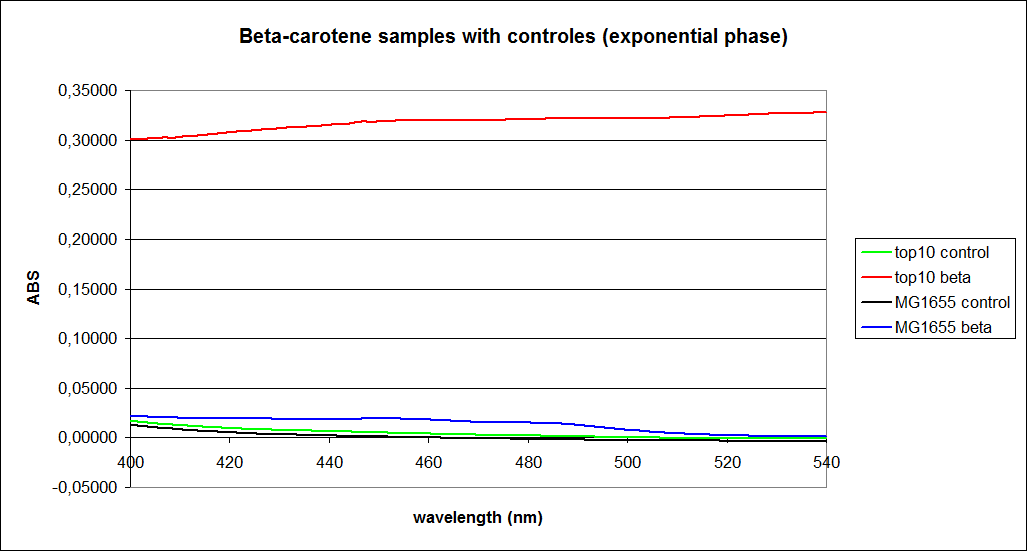
Since the first experiment showed no or small amounts of product in cells grown to exponential phase the measurements were performed on cells incubated for 20 hours at 37degrees Celcius and 180rpm. The graphs obtained from the experiment are presented below:
In the spectre a sudden drop from 330 to 320 nm occurs, this can be caused when the samples was auto zeroed according to acetone which is the solvent used in the extraction of the beta-carotene and Retinal.
The graph also shows that cell material interferes with the UV-vis measurement where the retinal has the strongest absorption. Therefore, an organic separation is required prior to the measurements.
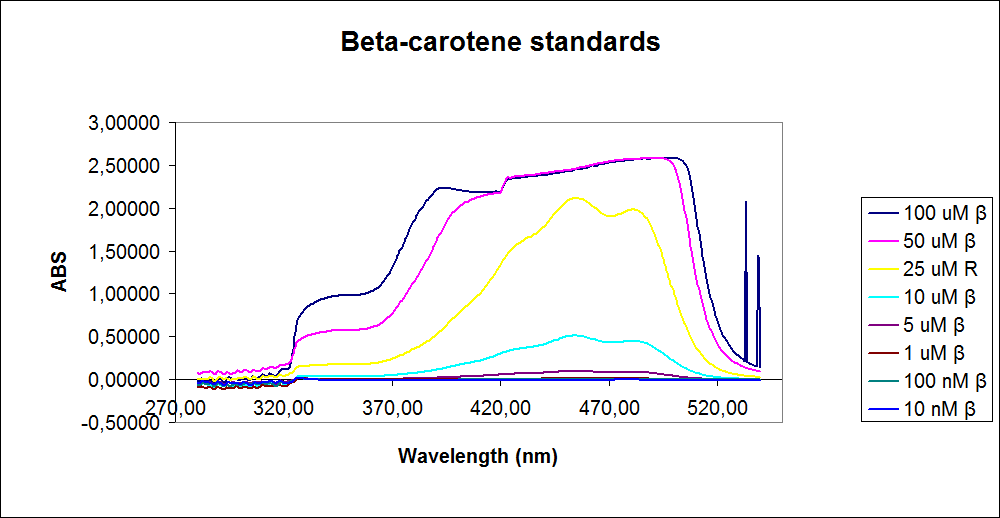
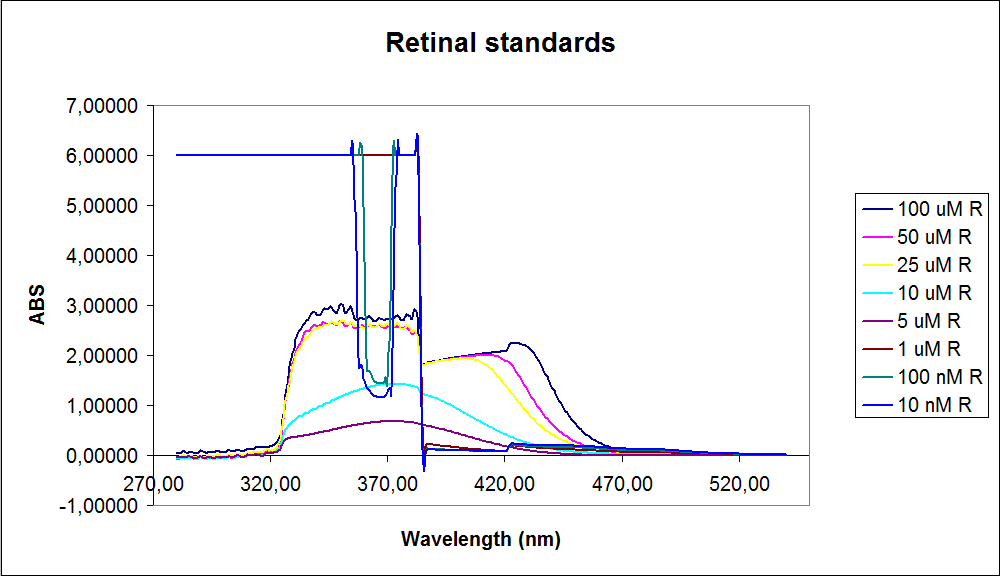
In order to assess the results, standard dilutions of beta-carotene and retinal were made and measured. The concentrations were 1mM, 100 µM, 50 µM, 25 µM, 10 µM, 5 µM, 1 µM, 100 nM and 10 nM. The standard dilutions were measured on the spectrophotometer. The resulting graphs are presented below:
The spectrum for the Beta-carotene looks normal and reliable, the standards for retinal however doesn’t look reliable. The spectrum for the three lowest concentrations appears to be give distorted and implies that something is interfering with the measurement.
The measurement jumps rapidly from nearly nothing to the maximum absorbance, this might be because the concentration of retinal is to low to be measured as a spectrum, but the concentration of the individual derivates of retinal might be high enough to be measured.
It might also just be that the concentrations are to low and something ells are influencing the measurements.
Because of the error in the UV-vis spectre concerning retinal detection in both the standards and samples the next characterization experiments is preformed on a HPLC.
All data can be seen under Raw data
K343006
HPLC determination of beta-carotene and retinal production
Apart from spectrophotometry, the resuspension of beta-carotene or retinal in acetone can be subjected to analysis by HPLC. HPLC can be used to separate retinal from beta-carotene, to get a better indication of whether or not our retinal-generating part actually produces retinal from beta-carotene.
In this experiment cells were prepared and harvested according to protocol EX1.1. This experiment was performed with six different strains of E. coli:
Wild type TOP10
Wild type MG1655
TOP10/pSB1A2-K274210
MG1655/pSB1A2-K274210
TOP10/pSB1A2-K274210/pSB1C3-K343005
MG1655/pSB1A2-K274210/pSB1C3-K343005
Both K343005 and K274210 were constitutively expressed.
MG1655 containing PSB1A2 with K274210 plus PSB1C3 with K343005 both under a constitutively active promotor
The measurements were preformed on cells after 20 hours of growth. The resulting graphs is presented beneath the text.
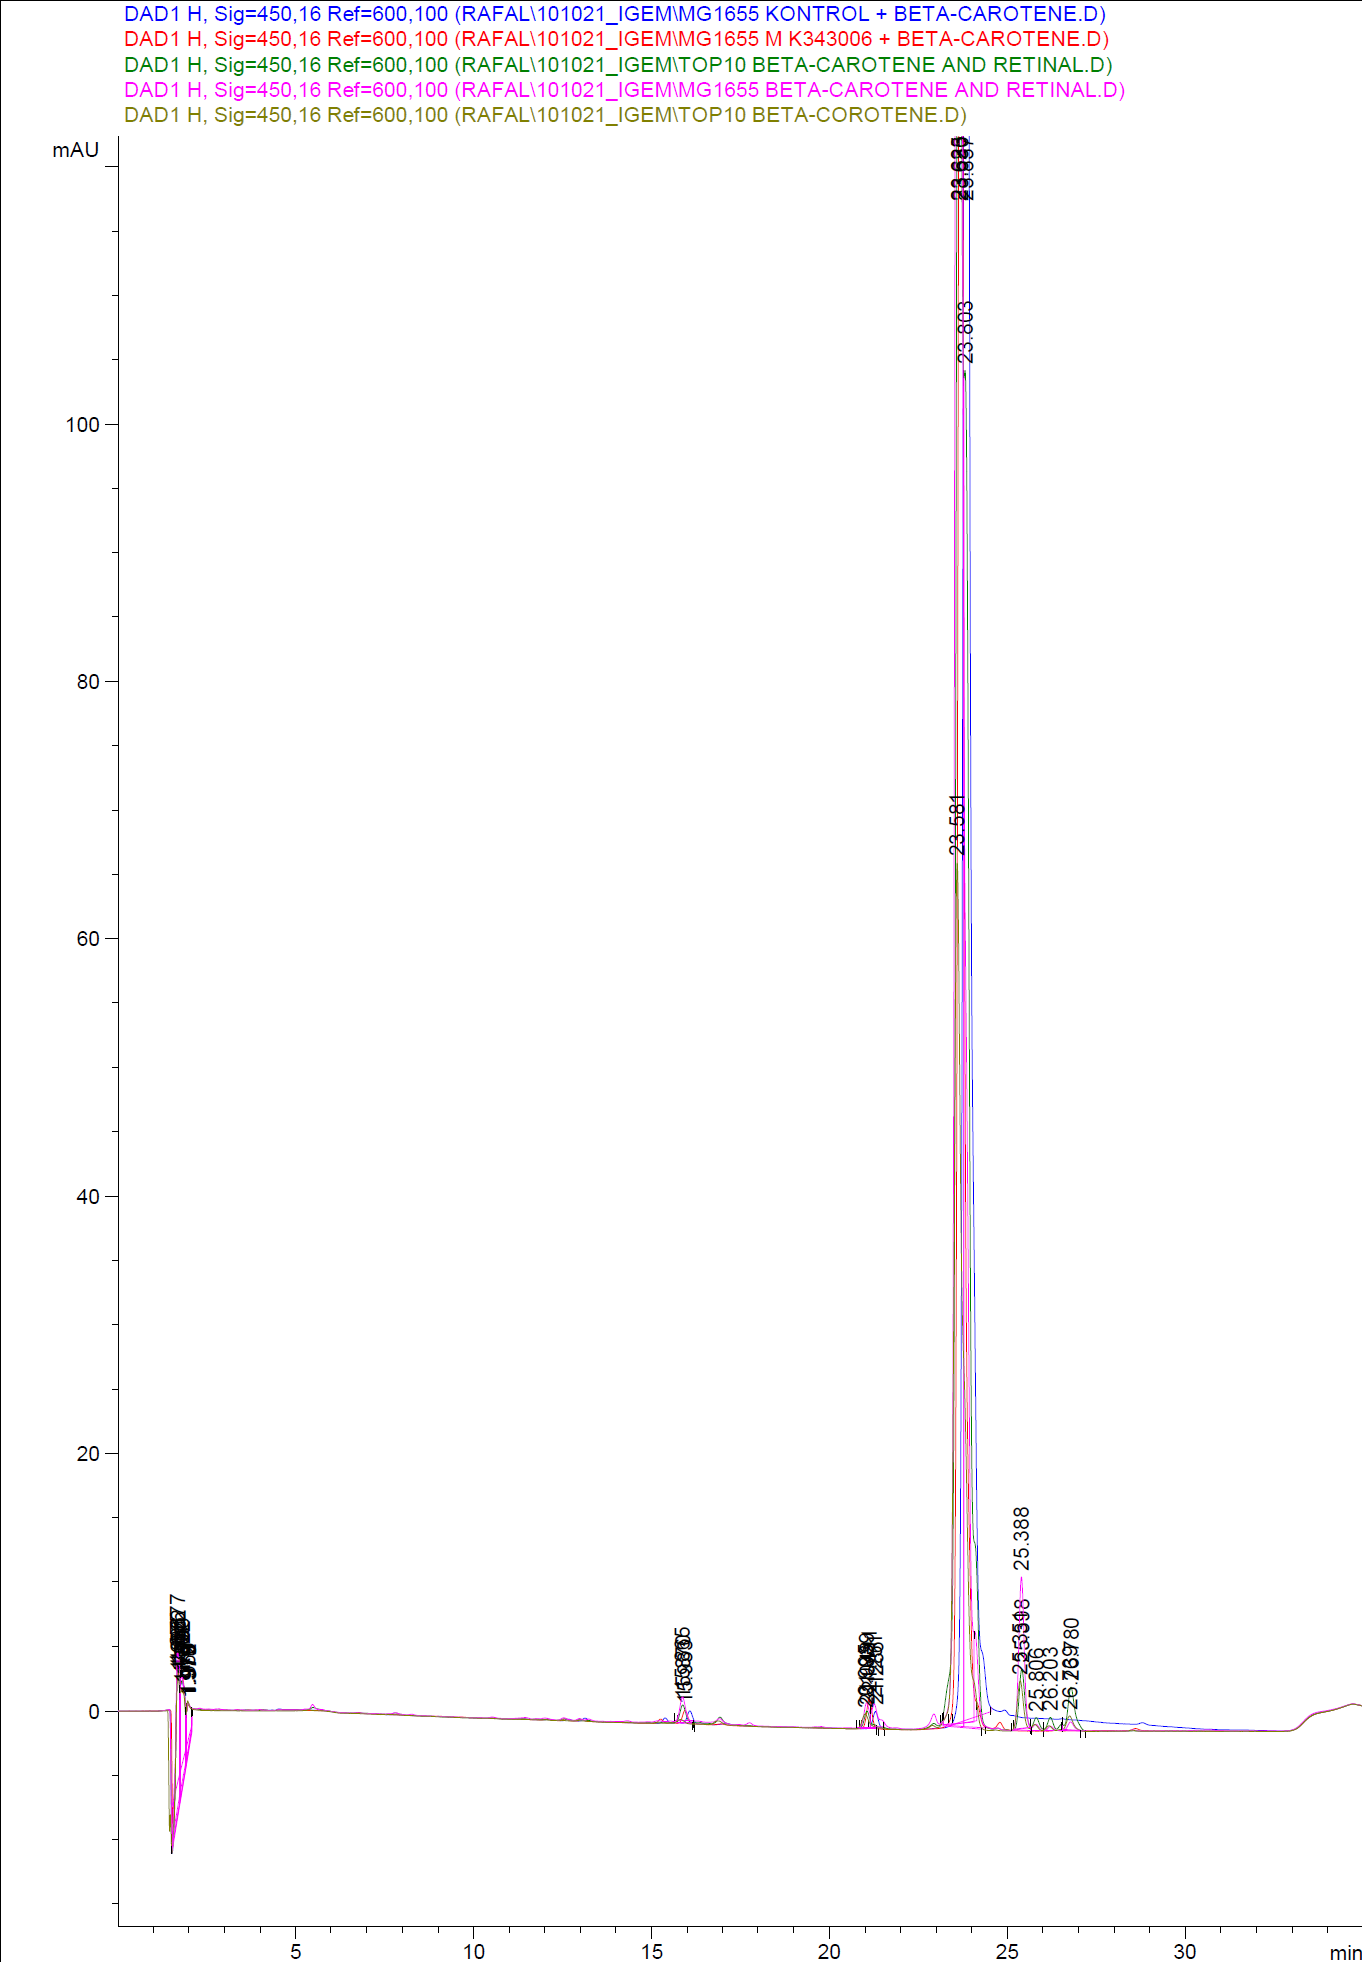
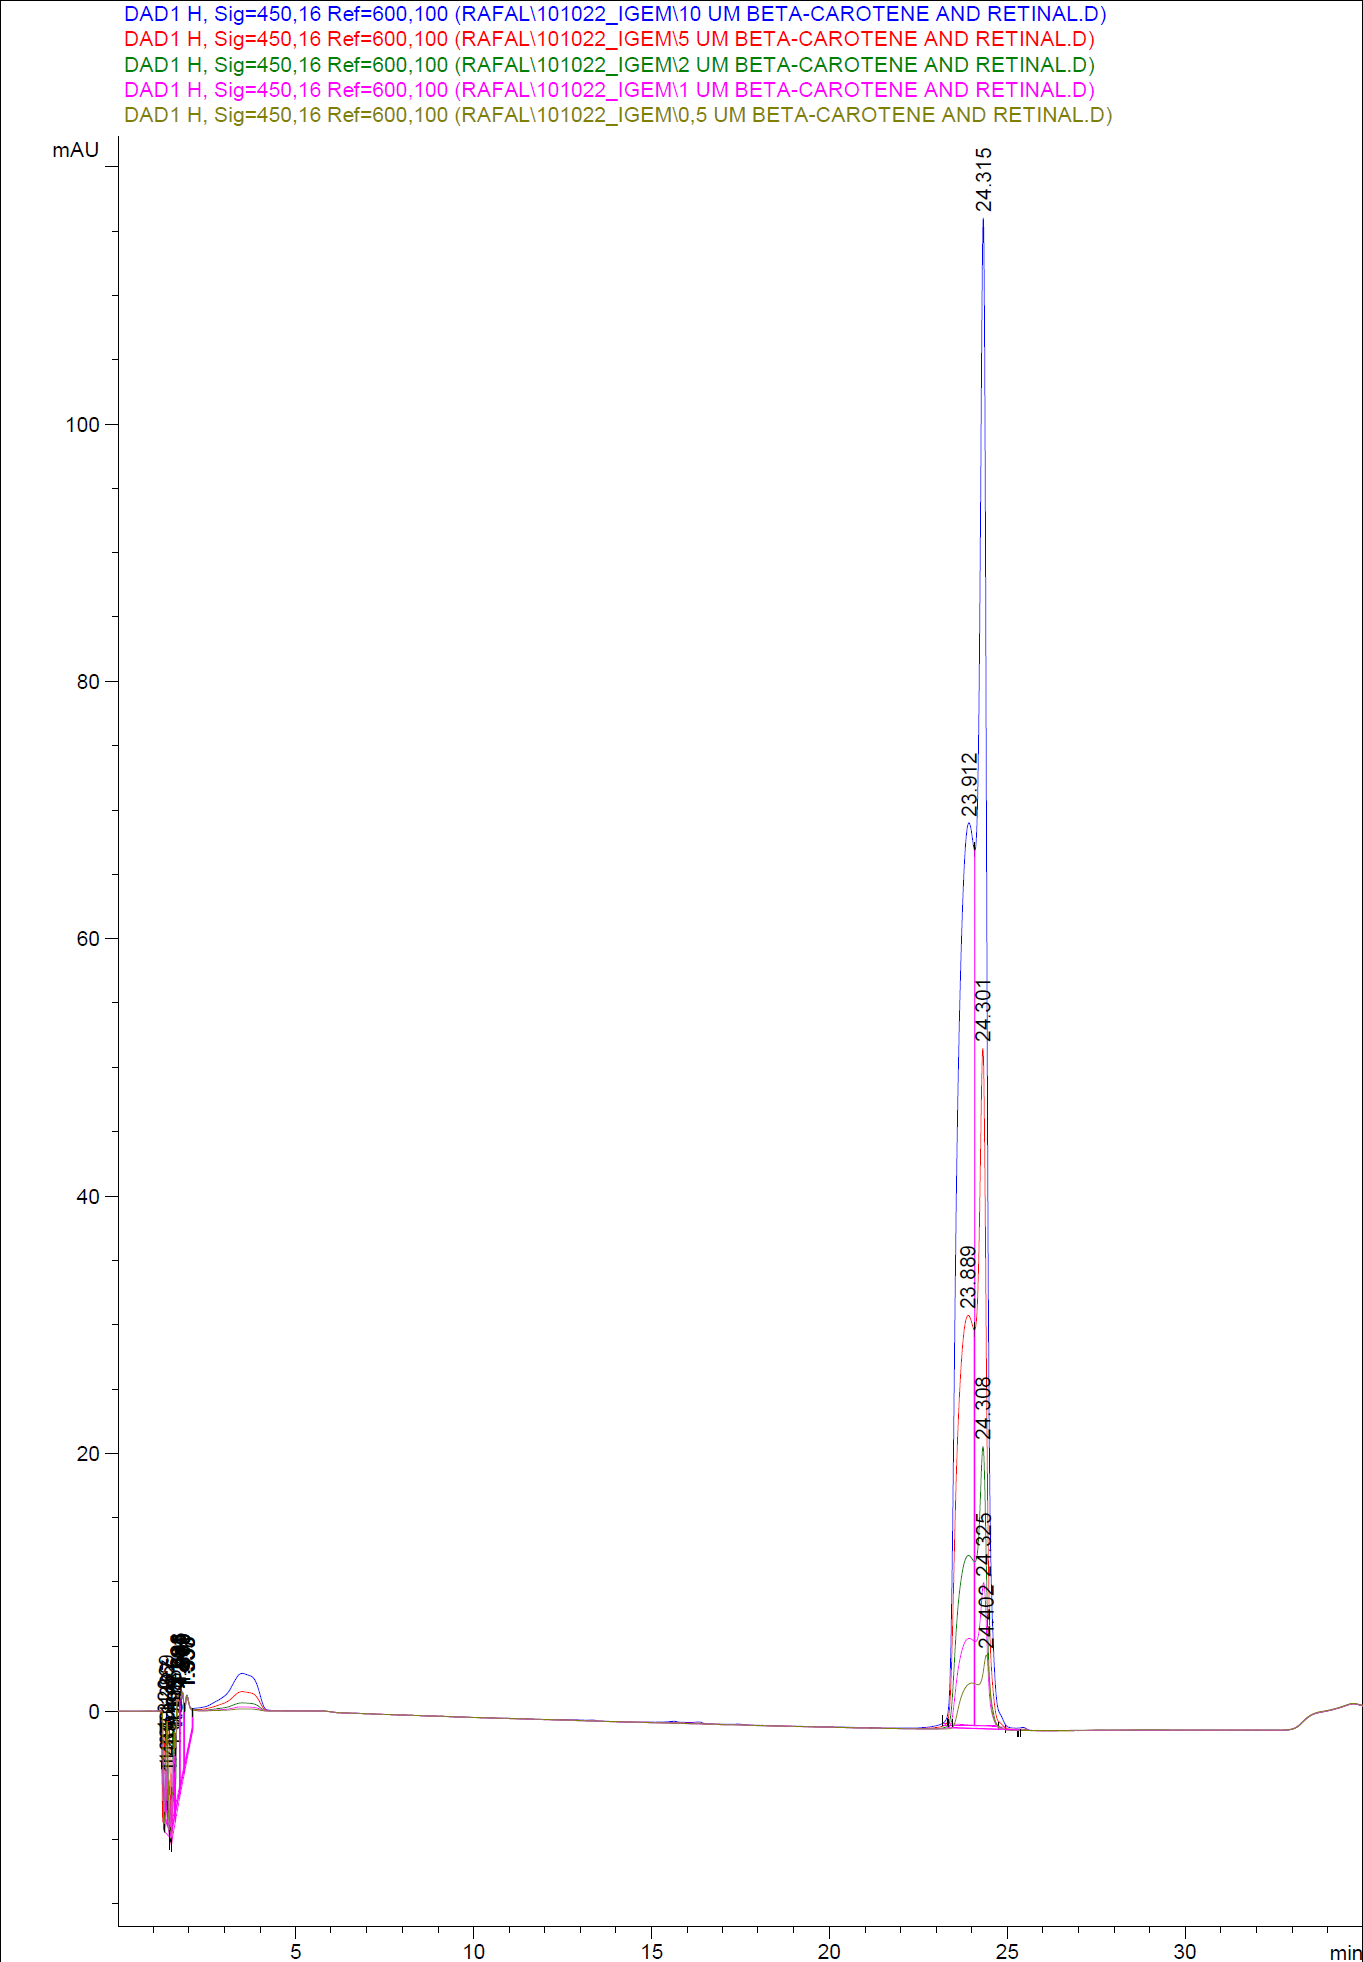
When looking at the retinal and beta-carotene standards analysed on the HPLC, peaks for both chemical are clearly present. The retinal retention time is 3,480-3,490 minutes and the beta-carotene retention time is 23,300-23,600 minutes.
The spectres for the first run of samples show large amounts of beta-carotene, smaller amounts of which also are products produced by the K274210 biobrick or absorbed form the media in the cells where the K274210 biobrick is absent.
The spectre shows no measurable amounts of retinal in neither of the samples, but the samples produced by bacteria containing the K343006 brick have a lower amount of beta-carotene.
which can indicated that either the bacteria’s production of beta-carotene is lowered or that some of the beta-carotene have been metabolized in the cell, either to a non-measurable concentration of Retinal or some other metabolite. It is also a possibility that the retinal is exported out of the cells.
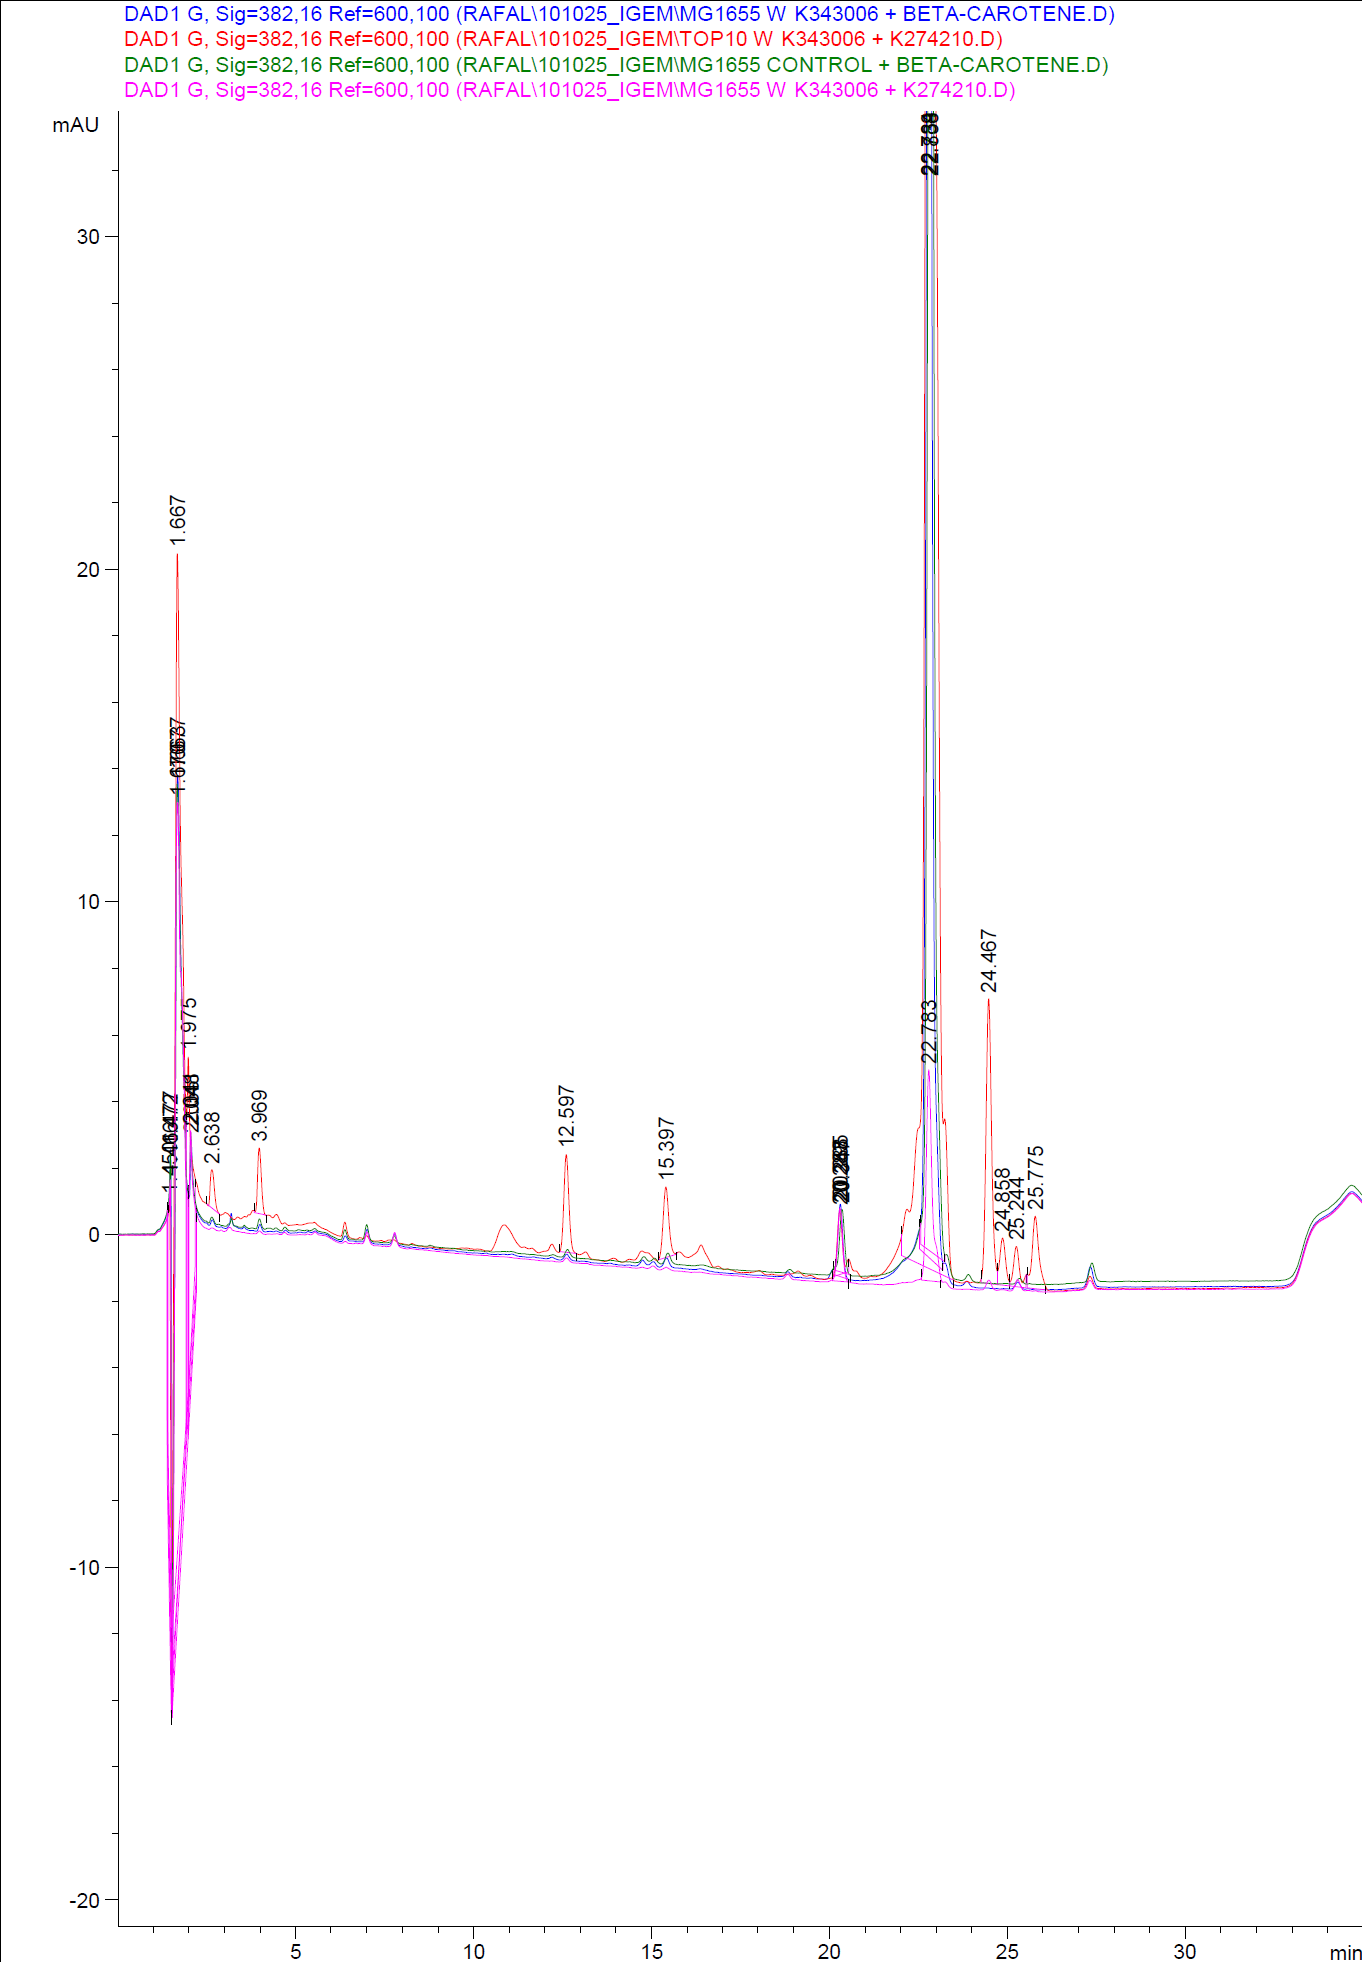
In the spectres from the second run of samples again show large amounts of beta-carotene produced by the K274210 biobrick or absorbed form the media in the cells where the K274210 biobrick is absent.
The only sample displaying any changes form the first run on the HPLC is TOP10 containing both the K343006 and K274210 biobricks. In the spectre higher amounts of cell metabolites some of them still being produced by the K274210 biobrick but also others produced by the cell.
In this spectra the peak with a retention time of 3,969 is close to the retention time of retinal form the standards but when examining the spectre of the peak it can be concluded that it not a retinal peak.
In order to assess and quantify the results a standard dilution of beta-carotene and retinal was made and measured: 10 µM, 5 µM, 1 µM, 2 µM, 0,5 µM. The standard dilutions were also measured on the HPLC with the same injection volumen and program as the samples. The resulting graphs are presented beneath
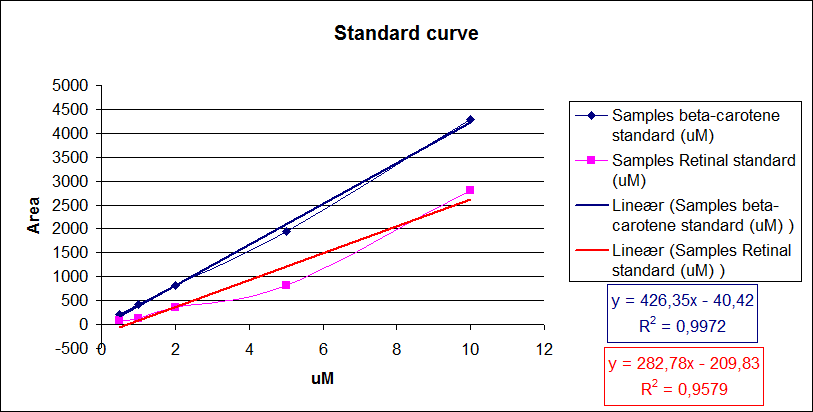
When doing a HPLC analysis it is possible to quantify the amounts of the chemical compounds in the samples.
This is done by doing a standard curve with known solutions of the chemical and recording the area under the peaks. The peak area correspond to the concentration of the chemical in the sample.
Then plotting the area under the peaks on the y- axis, the know concentrations of the standards on the x-axis and calculating the regression line.
Now it is possible to calculate unknown concentrations from samples using the regression line from the standard curves.
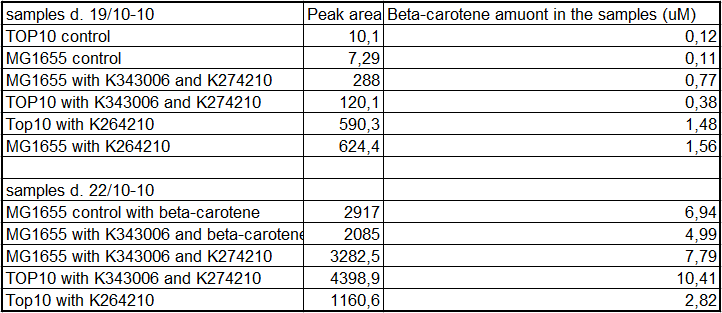
The results for our HPLC analysis can be seen beneath the text.
From the equations for the regression line it is possible to calculate the amount of beta-carotene produced by bacteria grown for 20 hours in LB media.
All data can be seen under Raw data
Stability assay
To dertermine the stability of our pSB1C3-K343006 plasmid, a stability experiment was carried out according to protocol[SA1.1]. E.coli MG1655/pSB1C3-K343006 was grown in LB media without chloramphenicol, whereby no selection pressure is excerted on the bacteria. Dilutions of the culture was spreaded on LA plates and LA plates with 35ug/mL chloramphenicol, respectively, and the colony forming units (cfu) was determined for each plate. The cfu for the LA plates represents the total amount of bacteria in the culture, and the cfu of LA plates with chloraphenicol corresponds to the amount of plasmid carrying bacteria. The percentage of the total amount of bacteria carrying the plasmid was plotted in a semi-logarithmic graph as a function of number of generations.
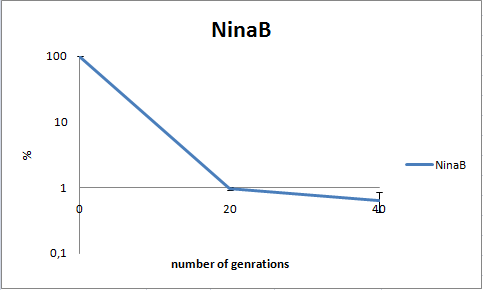
As seen in the graph, almost all of the bacteria had shedded the plasmid after 20 generations, suggesting that the plasmid is only stable within the cell for a few generations (<20). This is presumably due to the strain brought upon the bacteria by the plasmid. Thereby when the bacteria are carrying a high-copy plasmid like pSB1C3-K343006 it is plausible that the bacteria will quickly shed the plasmid when no longer exposed to a selection pressure.
Growth assay
The purpose of this assay is to see if our transformants deviate from the wild type in growth rate. In the growth measurement assay we have measured OD at 550 nm every hour for 12 hours and at hour 24. In the experimental setup we used no lag phase was observed in any of the measurements.
The graph below shows the growth of our wild type E. coli strain MG1655, the MG1655/pSB1C3-K343006 respectively.

From our data we see no significant difference between the plasmid carrying bacteria and the wild type. This can be said to be quite conteradictory to our results obtained from the stability assay. The transitory stability of pSB1C3-K343006 suggests that it is highly unfavorable for the bacteria, wherefore it might be expected that the growth of the bacteria containg this plasmid would be affected. Thus, however much a disadvantage the plasmid pose to the bacteria, their growth are not significantly influenced by the plasmid. The added reproduction load due to the plasmids, might also prolong the lag phase of the bacteria. Whether this is the case can not be concluded based on this experiment as no lag phase was observed in this experiment.
Helping another iGEM Team with characterization
2010 Bielefeld brick K389016
We recieved a miniprep with K389016 in pSB1C3 together with a list of experiments and characterization assays the Bielefeld team would like us to carry out.
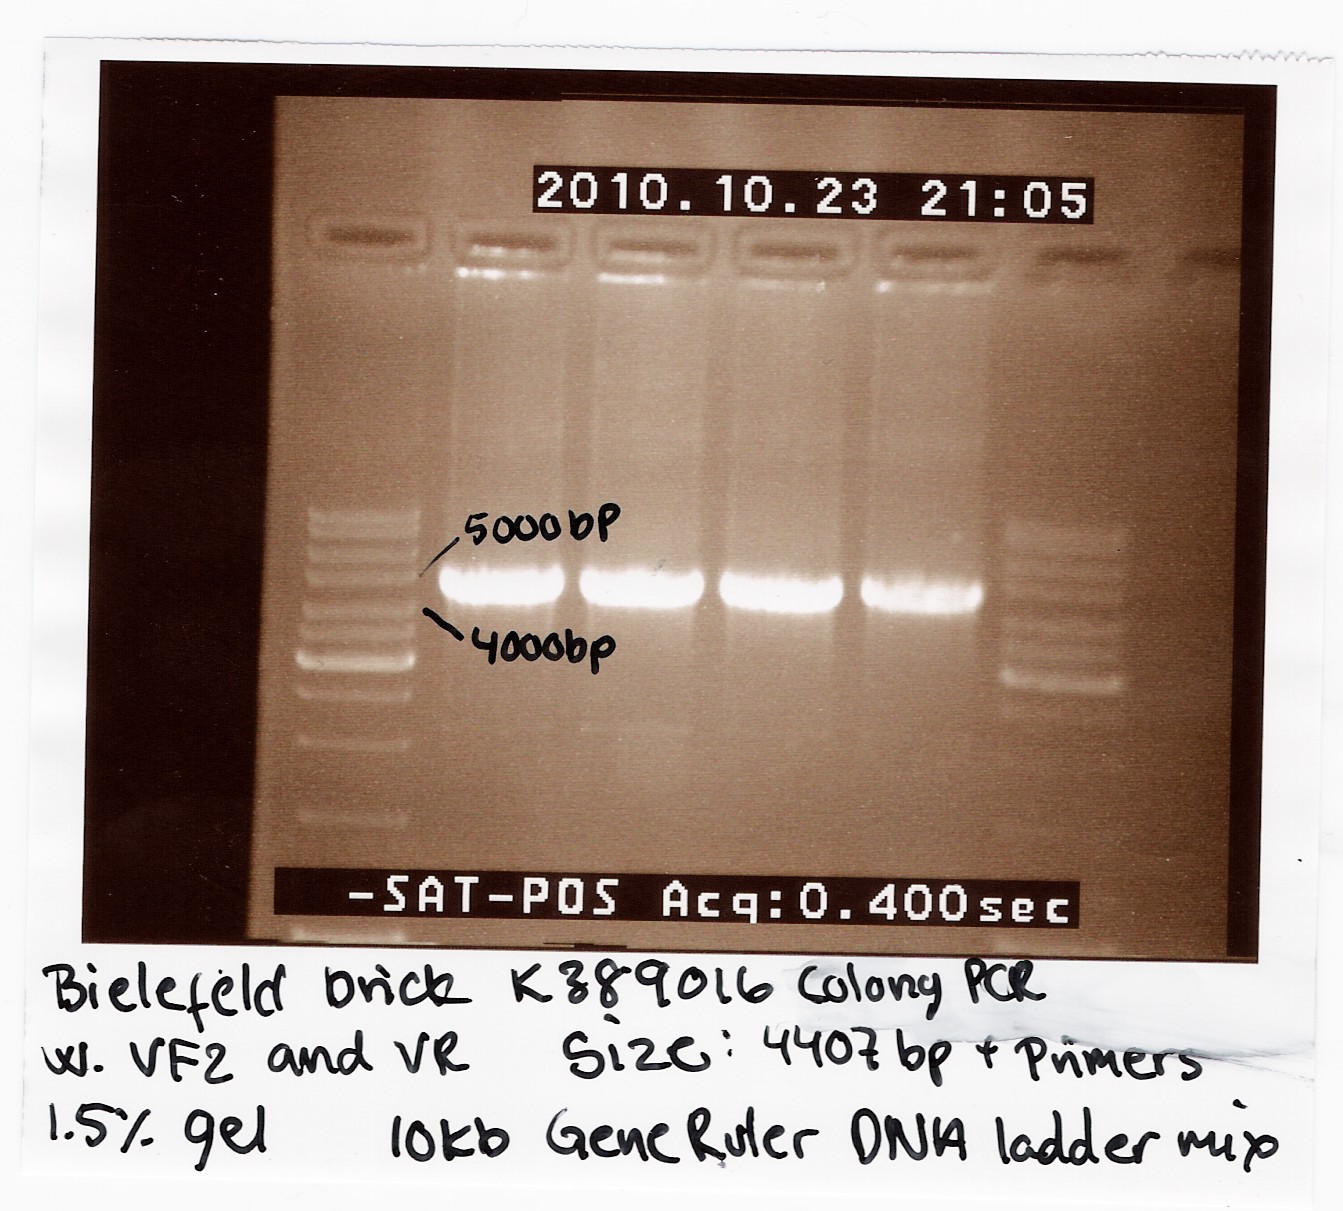
We transformed the plasmids into E. coli strain MG1655 and ran a colony-PCR of four different colonies the following day. Over night cultures of the colonies was made and used for fluorescence measurements. The picture shows that cells in all four colonies contained K389016 in pSB1C3.
Characterization
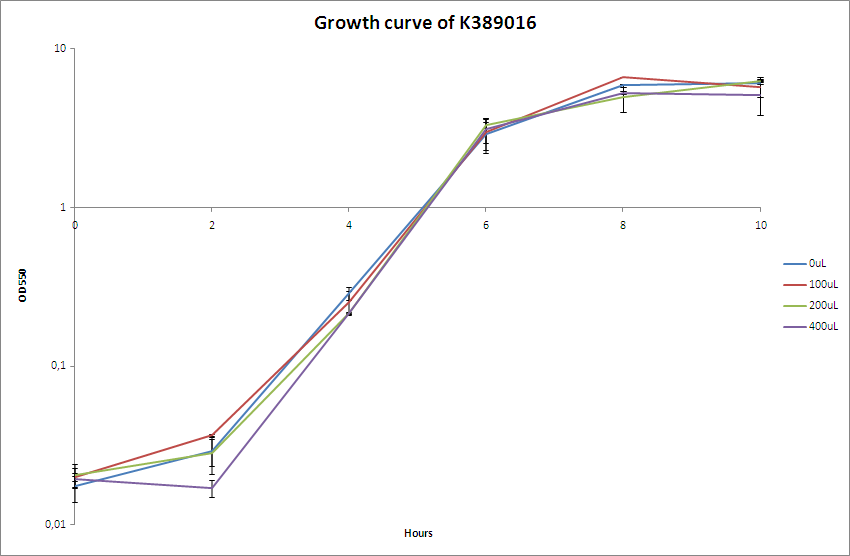
The Bielefeld team wanted us to verify their characterization results of K389016 (VirA/G reporter device mRFP). The characterisation experiment were carried out according to protocol (CK1.1). The transformant were grown with different inducers, acetosyringone, concentrations: 0uM, 100uM, 200uM and 400uM. The culture without acetosyringone was used as a control. The cultures were incubated at 37 degrees Celsius, until the cells reached stationary phase. A growth assay was carried out with measurements taken at OD550, every 2 hours for 10 hours. Parallel with the OD550 measurements samples were taken and used for fluorescence measurements.
The fluorescence measurements was carried out on a Perkin Elmer LS55 fluorescence spectrometer. We were unable to detect any RFP in the cells. We furthermore tested the cells on a Typhoon Trio but once again we could not detect RFP. We duplicated the experiment two times, but none were successful.
We were advised by the Bielefeld team to use excitation 584nm and emittance 607nm. This was done when using the Perkin Elmer LS55 fluorescence spectrometer, but the Typhoon trio has limited settings and according to the Typhoon trio manual RFP can be detected at excitation 633nm and emittance 670nm.
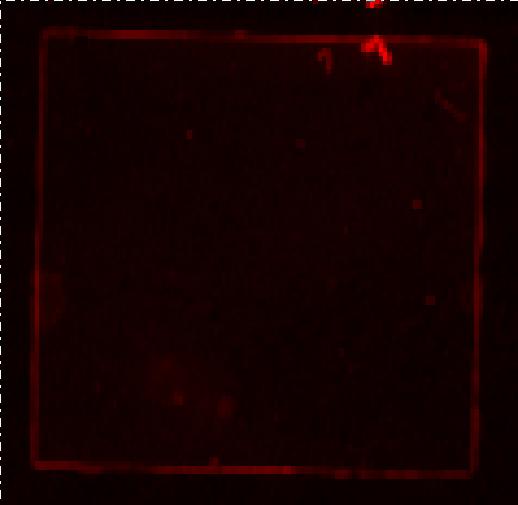
The picture above shows the fluorescence scanning prefomed on the Bielefeld part induced with 200uM acetosyringone. We spinned an over night culture of MG1655-pSB1C3-K38901 down, removed the supernatant and resuspended the pellet i LB-media. The resupension was transfered to a glass slide and covered by a cover slide. No emittans is seen in the picture, any light seen on the picture is noice.
Characterizing an exicting biobrick
2009 Cambridge brick K274210
The K274210 brick was cultivated from the 2010 kit plate 3 well N6 in the PSB1A2 plasmid and transformed into E. coli strains TOP10 and MG1655.
Characterization
UV-vis determination of beta-carotene production
In this experiment cells were prepared and harvested according to protocol [1]. This experiment was performed with four different strains of E. coli:
Wild type TOP10
Wild type MG1655
TOP10/pSB1A2-K274210
MG1655/pSB1A2-K274210
TOP10/pSB1A2-K274210/pSB1C3-K343005
MG1655/pSB1A2-K274210/pSB1C3-K343005
K274210 were constitutively expressed.
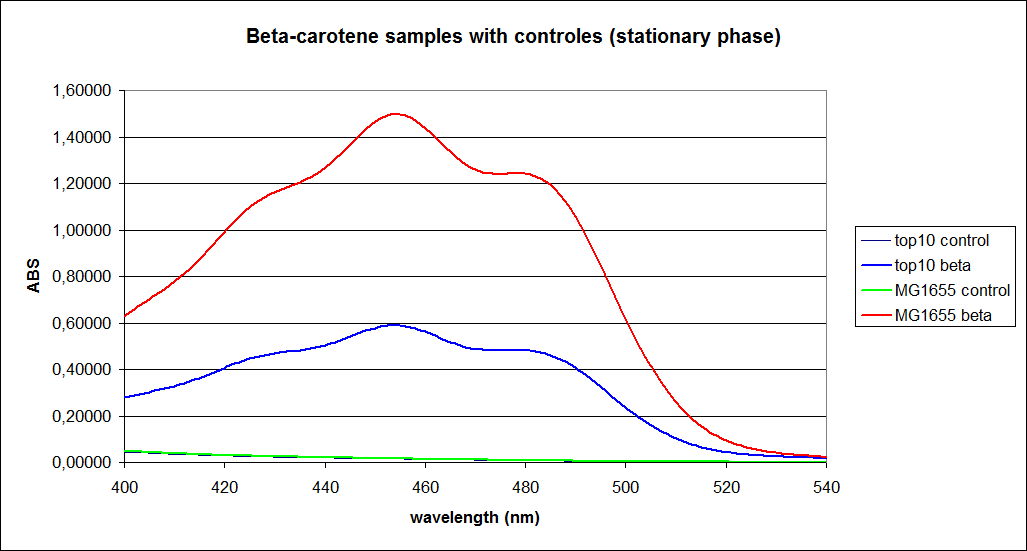
The measurements were performed on cells both in the exponential and stationary phase. The resulting graphs are presented below:
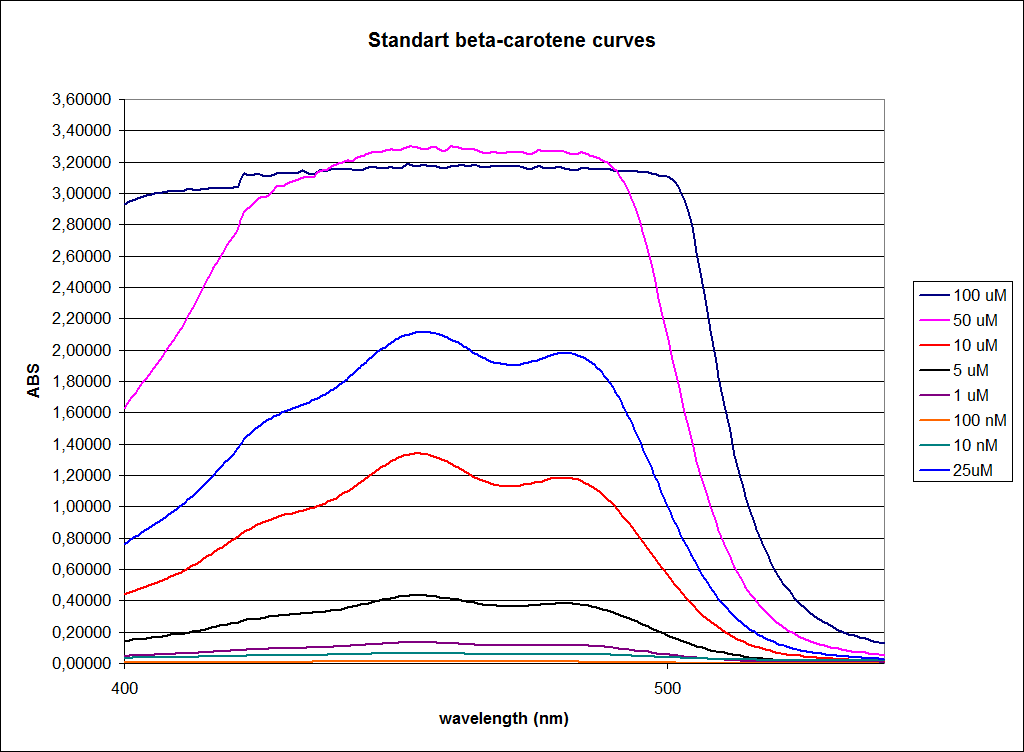
In order to assess the results, a series of standard dilutions of beta-carotene were made. The concentrations were 1mM, 100 µM, 50 µM, 25 µM, 10 µM, 5 µM, 1 µM, 100 nM and 10 nM. The standard dilutions were also measured on the spectrophotometer. The resulting graphs are presented low:
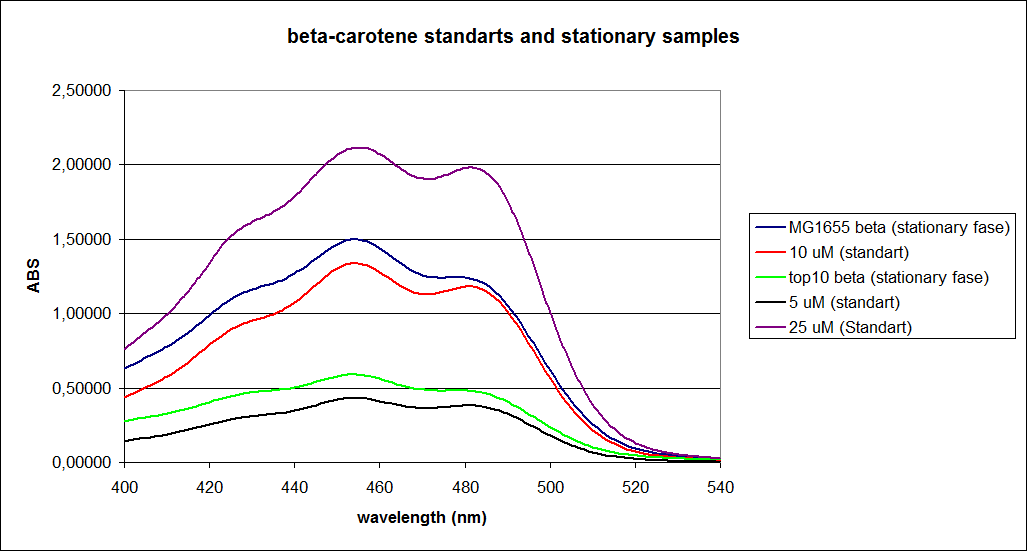
When combining the graphs of the samples and the standard dilutions, it is clear that the spectres are uniform. This similarity of the spectres indicates that the cells actually do produce beta-carotene. The graphs also give a qualitative indication of the amount of beta-carotene produced by the MG1655 and the Top10 E. coli cells. The resulting graphs are presented below:
The graph shows that the beta-carotene production of TOP10 containing pSB1A2 with constitutively active K274210 produces beta-carotene in a concentration just above 5 µM.
The MG1655 containing pSB1A2 with constitutively active K274210 produces beta-carotene in a concentration just above 10 µM.
All data can be seen under
Raw data
The K274210 brick have also been characterized together with the K343005 and K343006 parts the data are represented in the characterization for the K343005 and K343006 parts.
References
[1] Derek L. Englert, Arul Jayaraman, Michael D. Manson,Methods in Molecular Biology, 2009, Volume 571, 1-23.
[2] Jung KH, Spudich EN, Trivedi VD, Spudich JL, An Archaeal Photosignal-Transducing Module Mediates Phototaxis in Escherichia coli J Bacteriol. 2001 Nov;183(21)
 "
"
