Team:Newcastle/modelling
From 2010.igem.org
(→SR1 and RocF models) |
Swoodhouse (Talk | contribs) (→Biochemical network in SBML) |
||
| (24 intermediate revisions not shown) | |||
| Line 1: | Line 1: | ||
{{Team:Newcastle/mainbanner}} | {{Team:Newcastle/mainbanner}} | ||
| - | == | + | =Modelling= |
| - | + | ||
| - | + | ||
| - | + | ||
| - | + | ||
| - | [ | + | In order to understand the behaviour of our parts, we computationally modelled them by encoding biochemical networks in [http://sbml.org SBML] and simulating them using [http://www.copasi.org COPASI]. |
| - | [ | + | |
| - | + | ||
| + | ==Calcium carbonate== | ||
| - | === | + | For more details, please see [[Team:Newcastle/Urease|Calcium carbonate precipitation via urease expression]]. |
| + | |||
| + | ===Flux balance analysis=== | ||
| + | |||
| + | In order to inform our calcium carbonate part design, [[Team:Newcastle/Urease#Flux_balance_analysis|we performed flux balance analysis]] to identify pathways which indirectly lead to urea hydrolysis. | ||
| + | |||
| + | [[Image:Newcastle_Arginine_and_Ornithine_Degradation.png|600px]] | ||
| + | |||
| + | Taken from [http://seed-viewer.theseed.org/seedviewer.cgi?page=Subsystems&subsystem=Arginine_and_Ornithine_Degradation&organism=224308.1 SEED] | ||
| + | |||
| + | |||
| + | |||
| + | Downloads: | ||
| + | *[[Media:Newcastle_FBA_growth.txt|Metabolic flux in standard conditions (maximal growth)]] | ||
| + | *[[Media:Newcastle_FBA_urease.txt|Metabolic flux during maximum urease activity]] (reaction rxn00101, Urea amidohydrolase), showing large flux through the L-Arginine amidinohydrolase reaction (rxn00394). | ||
| + | *[[Media:Newcastle_flux_balance_analysis.m.txt|Matlab code]] | ||
| + | |||
| + | |||
| + | ===Biochemical network in SBML=== | ||
| + | |||
| + | We wrote a computational model of our [[Team:Newcastle/Urease|calcium carbonate system]] in SBML and simulated it in COPASI. The graph below shows that carbonate increases over time, as desired. | ||
| + | |||
| + | [[Image:ModelrocFsr1.png|600px]] | ||
| + | |||
| + | Downloads: | ||
| + | *[[Media:Newcastle_urease.mod.txt|SBML-shorthand]] | ||
| + | *[[Media:Newcastle_urease.xml.txt|SBML]] | ||
| + | |||
| + | ==Filamentous cells== | ||
| + | |||
| + | For more details, please see [[Team:Newcastle/Filamentous_Cells|Filamentous cells]]. | ||
| + | |||
| + | ===Biochemical network in SBML=== | ||
| + | We wrote a computational model of our filamentous cell system in SBML and simulated it in COPASI. The graph below shows that FtsZ ring formation is low when ''yneA'' is overexpressed. | ||
| + | |||
| + | [[Image:Newcastle_ModelFilamentous.png|600px]] | ||
| + | |||
| + | Visualisation of the model's biochemical network in CellDesigner: | ||
| + | |||
| + | [[Image:Newcastle CellDesigner Filamentous.png|600px]] | ||
| + | |||
| + | Downloads: | ||
| + | *[[Media:Newcastle_filamentous.mod.txt|SBML-shorthand]] | ||
| + | *[[Media:Newcastle_filamentous.xml.txt|SBML]] | ||
| - | |||
{{Team:Newcastle/footer}} | {{Team:Newcastle/footer}} | ||
Latest revision as of 16:16, 26 October 2010

| |||||||||||||
| |||||||||||||
Contents |
Modelling
In order to understand the behaviour of our parts, we computationally modelled them by encoding biochemical networks in SBML and simulating them using COPASI.
Calcium carbonate
For more details, please see Calcium carbonate precipitation via urease expression.
Flux balance analysis
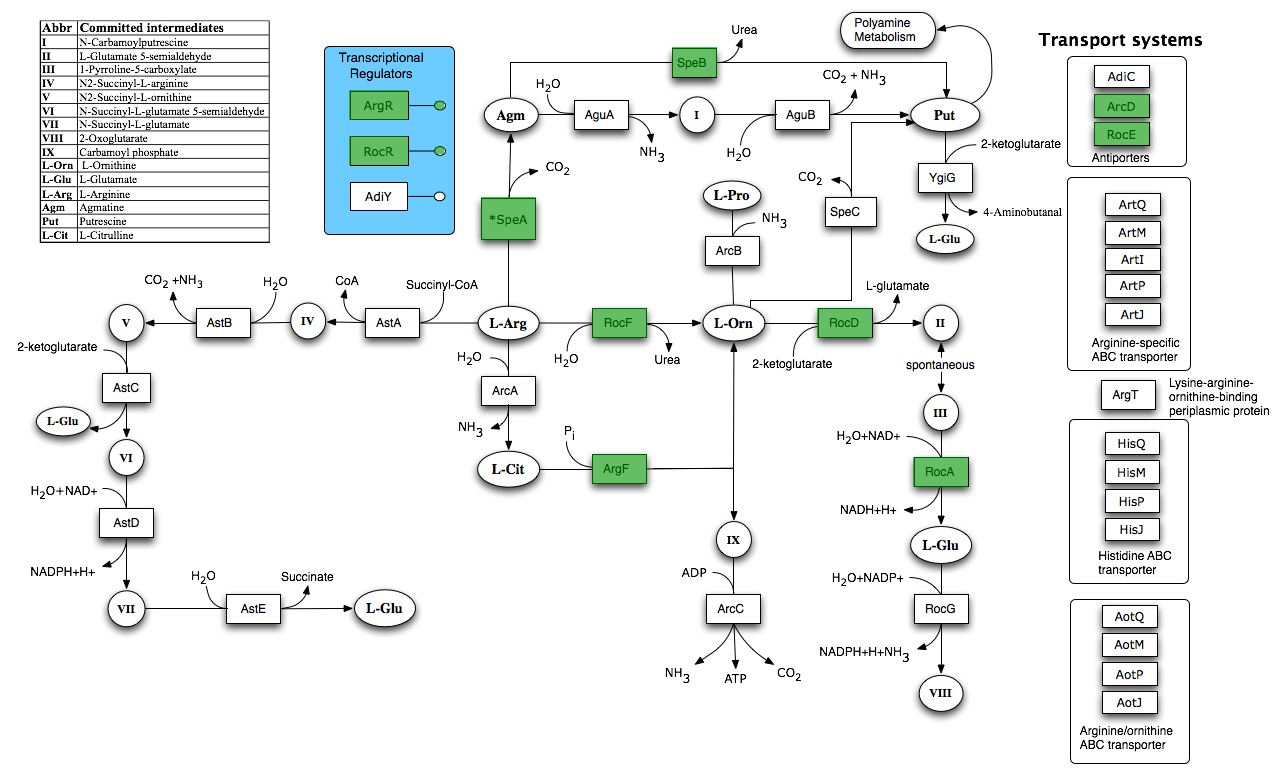
In order to inform our calcium carbonate part design, we performed flux balance analysis to identify pathways which indirectly lead to urea hydrolysis.
Taken from SEED
Downloads:
- Metabolic flux in standard conditions (maximal growth)
- Metabolic flux during maximum urease activity (reaction rxn00101, Urea amidohydrolase), showing large flux through the L-Arginine amidinohydrolase reaction (rxn00394).
- Matlab code
Biochemical network in SBML
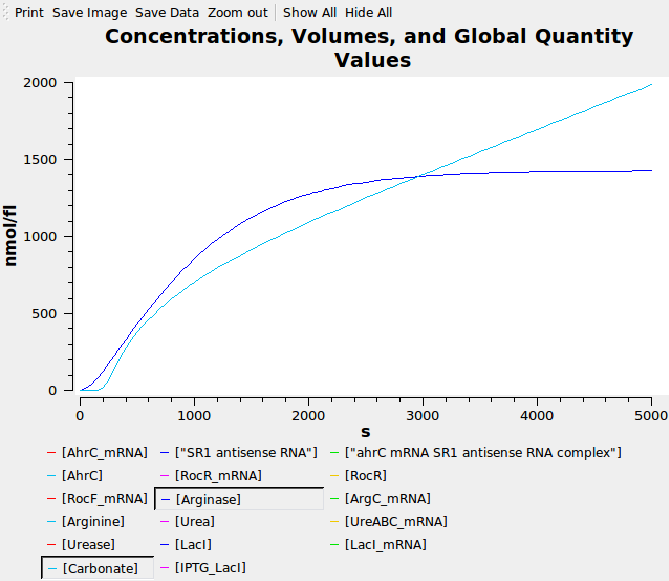
We wrote a computational model of our calcium carbonate system in SBML and simulated it in COPASI. The graph below shows that carbonate increases over time, as desired.
Downloads:
Filamentous cells
For more details, please see Filamentous cells.
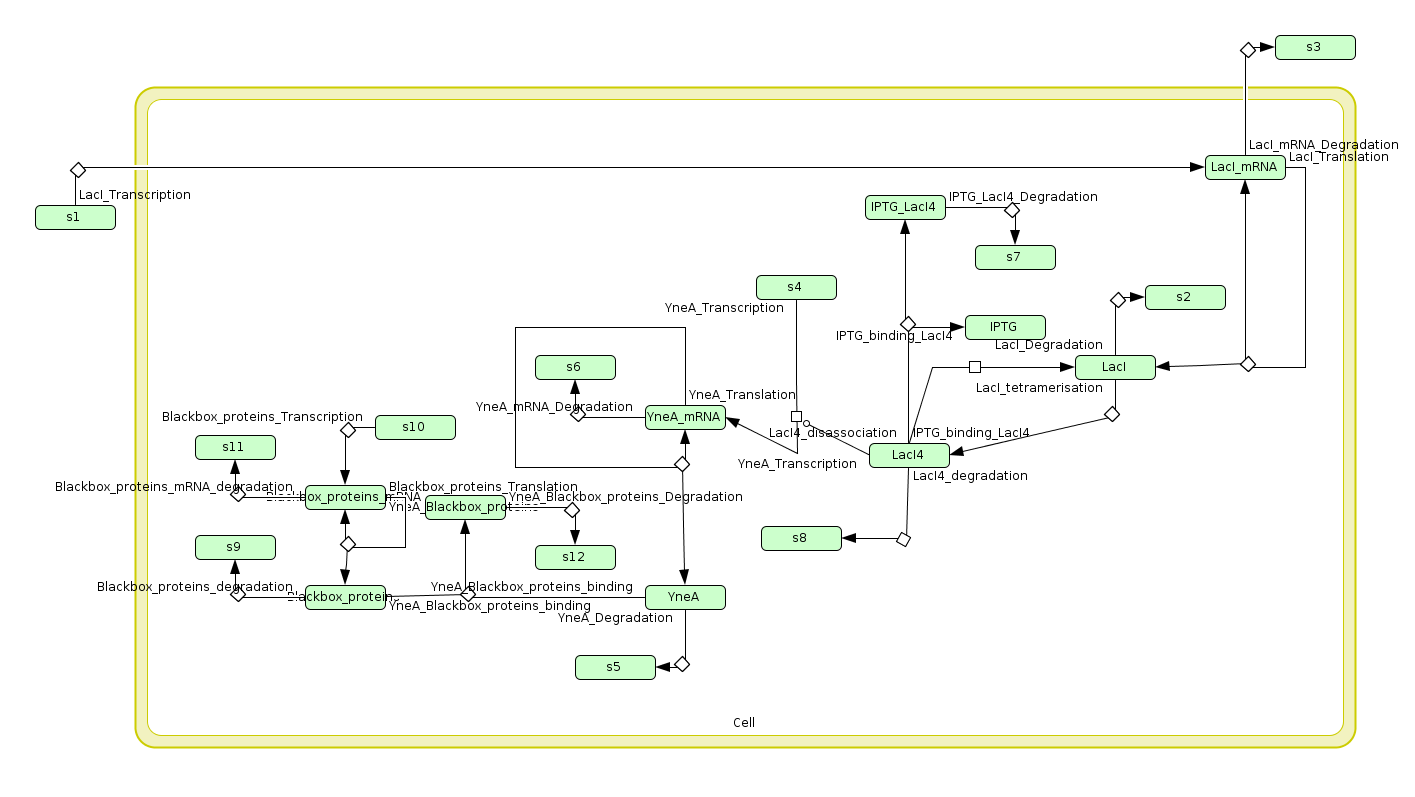
Biochemical network in SBML
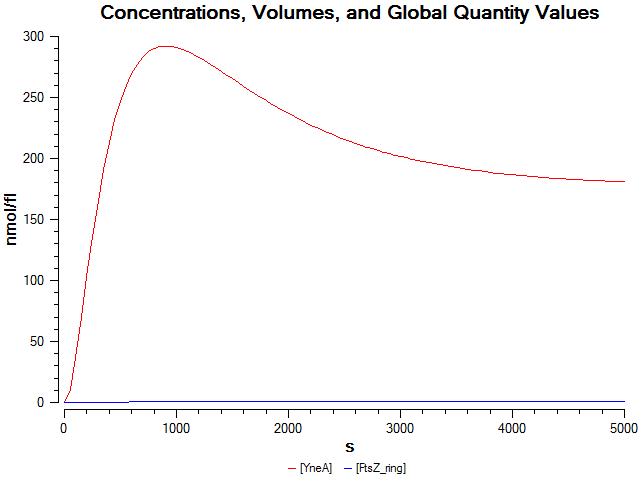
We wrote a computational model of our filamentous cell system in SBML and simulated it in COPASI. The graph below shows that FtsZ ring formation is low when yneA is overexpressed.
Visualisation of the model's biochemical network in CellDesigner:
Downloads:
 
|
 "
"


