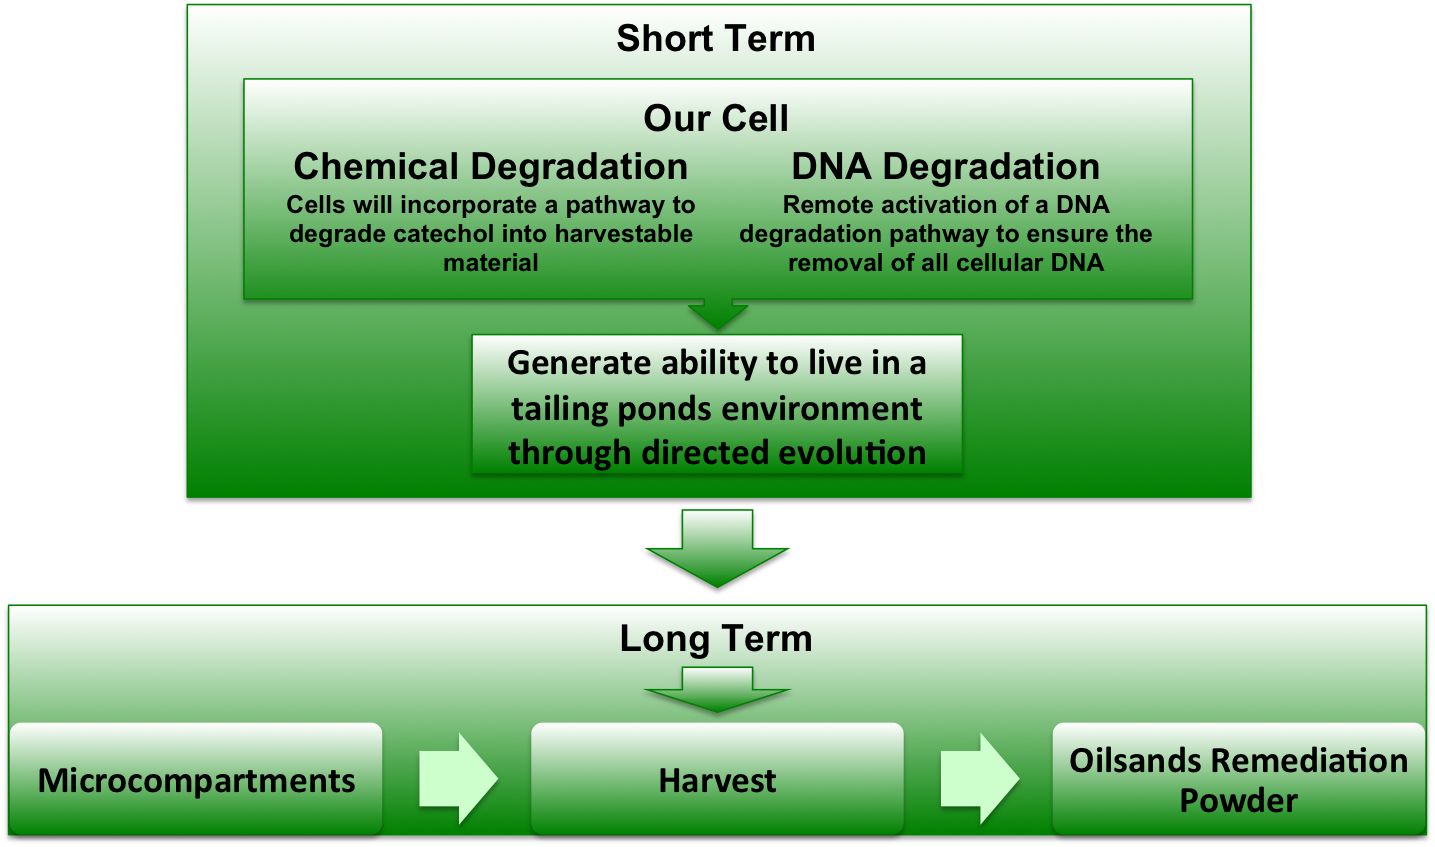
This years iGEM team has undertaken two separate modeling projects to help us carry out and understand our project.
Metabolic Modeling
Why Metabolic Modeling
The majority of degredation pathways for oilsands contaminants convert various organic compounds into catechol. Our project this year in the incorporation of the gene xylE into E. coli. The xylE gene encodes catechol-2,3,-dioxygenase, which converts catechol into 2-hydroxymuconate semialdehyde. This semialdehyde can be metabilized by E. coli by means of the glycolysis / Krebbs cycle.
However, little is known about how the effect of increased flux of these metabolites into cell (such as intermediate concentrations and metabolite fluxes). Thus to asses the viability of specialized bioremediation and metabolic engineering it is very important to understand what is happening within the cell. By using computer modeling of metabolism pathways and using kintetic data, we can asses the robustness of the system and what we can do to improve the efficiency of the system.
The Model
The proposed model will include the entire glycolysis / Krebbs cycle and the entry of catecol and 2-hydroxymuconate semialdehyde into it alongside normal metabolites. Databases (such as BRENDA) have detailed all the pathways and should have most if not all the kinetic parameters required.
The Questions/Answers
1) What is the maximal rate of catechol degradation by the cell by this pathway?
2) What are the rate limiting steps and what can be done to increase throughput (i.e. the effect of increasing the expression of one or two proteins)?
3) At excessively high levels of catechol, what is the effect on the system (robustness of the system)?
These a very important questions as many iGEM projects use catechol as their entry point into bacterial metabolism. To enable metabolic engineering an understanding of what is occurring within the cell is crucial.
Homology Modeling
Another aspect of our project is working on the localization of catechol-2,3,-dioxygenase (and other proteins) into the interior of microcompartments. To target the protein into the microcompartment (Lumazine modified to have an even more charged interior) requires the fusion of a polyarginine tail to either the C or N terminus of the protein.
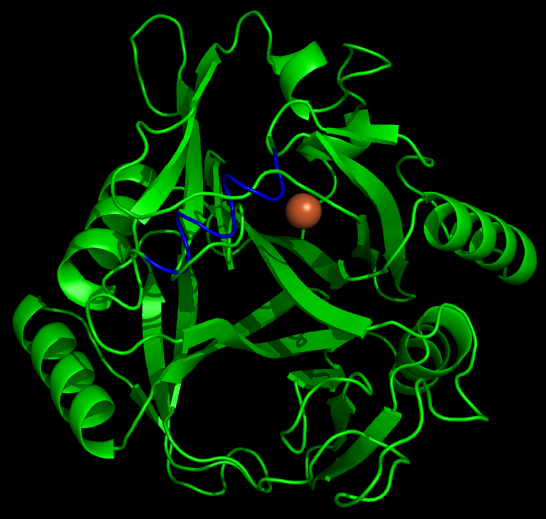
As with any fusion protien, the addition of this polyarginine tail to the protein has the very real potential of blocking (at least partially) the active site of a protein. Thus if one can predict the structure of the protein with the addition of the tail, it is possible to avoid creating inactive/ low efficiency fusion proteins.
The Method and Results
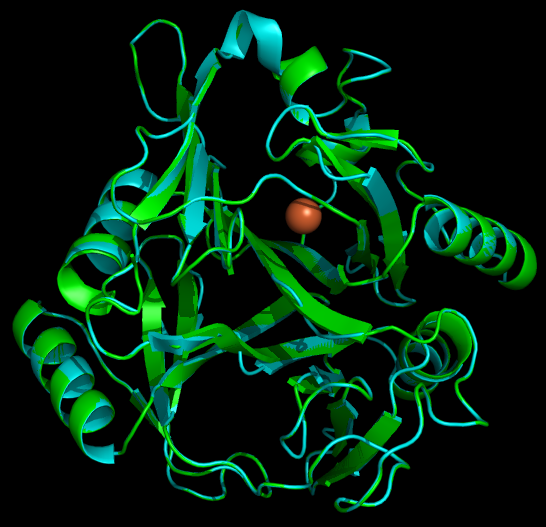
To model the XylE structure, the sequence for XylE from Pseudomonas putida (NCBI accession number NP_542866) was aligned with the primary sequence from the crystal structure of XylE from the same organism (pdb: 1MPY; several differences in amino acid sequence were observed) using CLUSTALW (1). Based on this sequence alignment, a homology model was generated using the alignment mode in SWISSMODEL (2-4). To model the placement of an N-terminal arginine tag, the tag was manually added to the N-terminus of the model. Energy minimization was carried out in SWISS-PDB viewer in vacuo utilizing a GROMOS96 energy minimization (2). The resulting pdb file was visualized and manipulated using PYMOL, images were taken using the same software (5).
References
1. Higgins, D. G., Thompson, J. D., and Gibson, T. J. (1996) Using CLUSTAL for multiple sequence alignments, Methods Enzymol. 266, 383-402.
2. Guex, N., and Peitsch, M. C. (1997) SWISS-MODEL and the Swiss-PdbViewer: An environment for comparative protein modelling, Electrophoresis 18, 2714-2723.
3. Kiefer, F., Arnold, K., Künzli, M., Bordoli, L., and Schwede, T. (2009) The SWISS-MODEL Repository and associated resources, Nucleic Acids Res 37, D387-D392.
4. Arnold, K., Bordoli, L., Kopp, J., and Schwede, T. (2006) The SWISS-MODEL Workspace: A web-based environment for protein structure homology modelling., Bioinformatics 22, 195-201.
5. DeLano, W. L. (2006) PyMOL, DeLano Scientific.
 "
"


