Team:Johns Hopkins/Project
From 2010.igem.org
SunPenguin (Talk | contribs) (→Instrumentation) |
(→Quantitative Characterization of FKS2 CDRE and PMC1 CDRE in Vacuole Positive and Negative Yeast) |
||
| Line 113: | Line 113: | ||
===Quantitative Characterization of FKS2 CDRE and PMC1 CDRE in Vacuole Positive and Negative Yeast=== | ===Quantitative Characterization of FKS2 CDRE and PMC1 CDRE in Vacuole Positive and Negative Yeast=== | ||
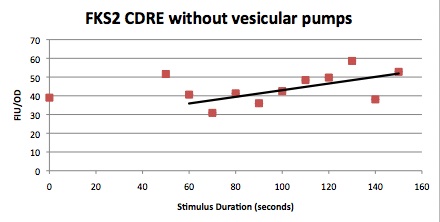
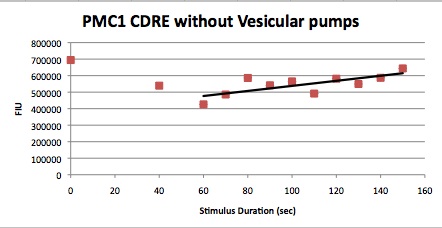
| - | At high time points, we observed that the unstimulated control often expressed as much as experimental samples. We postulated that this was a result of widespread cell death. While we normalized against OD, this can only account for cell density, not cell viability. | + | At high time points, we observed that the unstimulated control often expressed as much as experimental samples. We postulated that this was a result of widespread cell death. While we normalized against OD, this can only account for cell density, not cell viability. We also noted that the data point at 40s (and later in one case) is consistently higher than many of the data with longer electrostimulation duration. We believe that this is the same effect. If this is so, it implies that the cell death that we observe is a steplike function of duration. |
In this experiment, cells with the FKS2 CDRE and the PMC1 CDRE were grown and passed into two rows of a 96 well plate and shocked at 8V with an exposure time of 0-80 seconds to quantitate the relationship between electrostimulation time and expression of a fluorescent protein. We again investigated the effect of knocking out the PMC1 and VCX1 vesicular calcium pumps. The data for both pump positive and pump negative cells are shown below.<br> | In this experiment, cells with the FKS2 CDRE and the PMC1 CDRE were grown and passed into two rows of a 96 well plate and shocked at 8V with an exposure time of 0-80 seconds to quantitate the relationship between electrostimulation time and expression of a fluorescent protein. We again investigated the effect of knocking out the PMC1 and VCX1 vesicular calcium pumps. The data for both pump positive and pump negative cells are shown below.<br> | ||
Revision as of 02:14, 28 October 2010
Contents |
Abstract
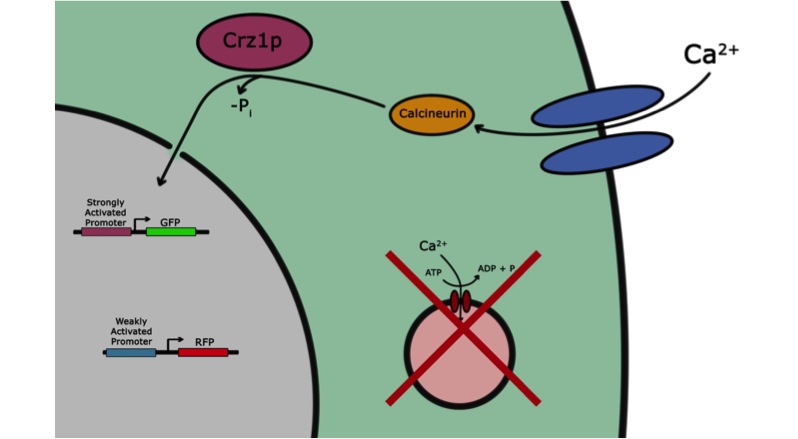
If the goal of iGEM and the Parts Registry is to take the messy world of genetic engineering and transform it into something like the standardized world of electrical engineering, it may be useful if electronic systems could directly interface with biological systems. Past iGEM projects have used chemical or optical stimuli to actuate transcriptional responses. Our project, however, seeks to add voltage sensitivity to Saccharomyces cerevisiae. Baker’s yeast was chosen because in some sense yeast have a system that responds to voltage input. With a voltage stimulus one can open the voltage-gated calcium channels of yeast, causing calcium ions to rush into the cytoplasm. This causes calcineurin to dephosphorylate Crz1, which enters the nucleus and binds various promoters. Our group presents a library of characterized Crz1-sensitive binding sites of both naturally-occurring and synthetic varieties that can be integrated into promoters. Genes downstream of these promoters are thus voltage-regulated in media containing calcium.
Aims
- Show that voltage can be used to stimulate a transcriptional response in S. cerevisiae.
- Develop a library of voltage-inducible elements with differing voltage response curves.
- Determine the functional range of and optimized values for our system with respect to the following variables:
- Voltage applied
- Duration of voltage application
- Presence or absence of vesicular calcium pumps, yeast’s natural mode of intracellular calcium control
- Develop an effective experimental apparatus to apply voltage and measure response.
Methods
Visualizing the Crz1 Transcription Factor
We wanted to visualize the behavior of Crz1 under electrostimulation, and confirm localization to the nucleus upon stimulation. The cells were induced, then mounted glass plate where they were imaged with a laser-scanning confocal microscope. GFP was observed to move in and out of the nucleus just 5 minutes after a voltage stimulus. In a given image, some cells displayed Crz1-GFP densely packed in the nucleus while other cells displayed Crz1-GFP in the cytoplasm, but excluded from the nucleus. Here we see a confirmation of the oscillating behavior described by Cai et al.
In the above video we can see the oscillatory behavior of Crz1-GFP after electrostimulation. Note that Crz1-GFP's oscillating movement into and out of the nucleus is not in phase throughout the cell population. Only a few cells actually exhibit a change in Crz1 localization during the course of the video.
Optimizing Parameters for the CDRE from the FKS2 Promoter
We wanted to find an optimal voltage amplitude and electrostimulation duration for yeast containing the CDRE-RFP plasmid. Shocking at 10V caused widespread cell death, so it was necessary to find a balance between transcription and cellular damage. CDRE-RFP were grown and passed into 96 well plate. The electroporator was used to shock the cells with voltages from 2-10V for 0-80 seconds. We found that optimal transcription occurs when electrostimulation voltage is 8V. We also needed at least 40 seconds of electrostimulation to see expression.
| 2s | 5s | 10s | 20s | 40s | 80s | |
|---|---|---|---|---|---|---|
| 10V | None | None | None | None | None | N/A |
| 8V | None | None | None | None | High | High |
| 6V | None | None | None | None | Moderate | High |
| 4V | None | None | None | None | Low | Low |
Cells were analyzed using the above described confocal microscopy. As such, our data are purely quantitative.
Qualitative Characterization of the FKS2 CDRE
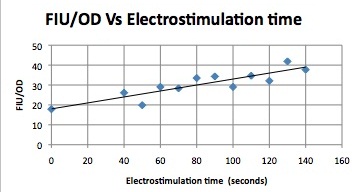
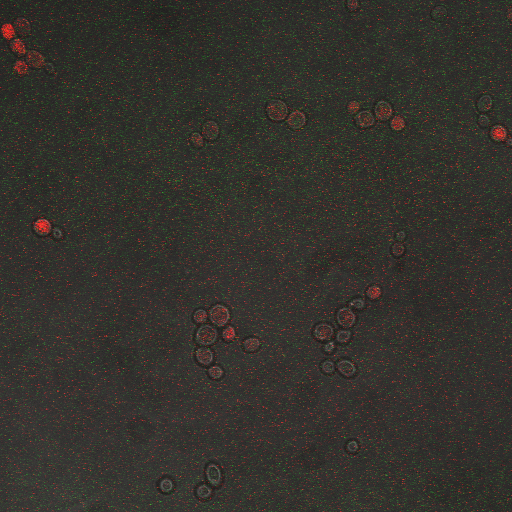
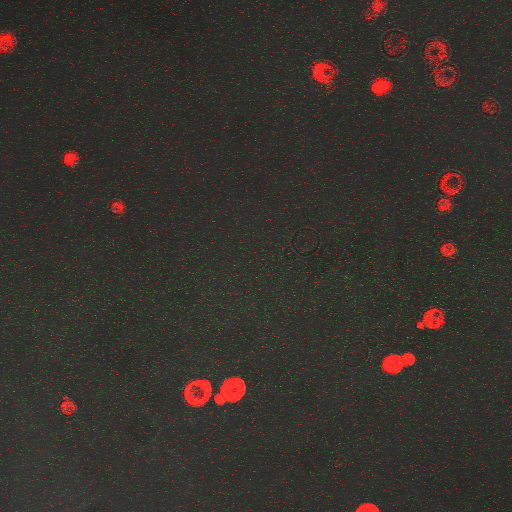
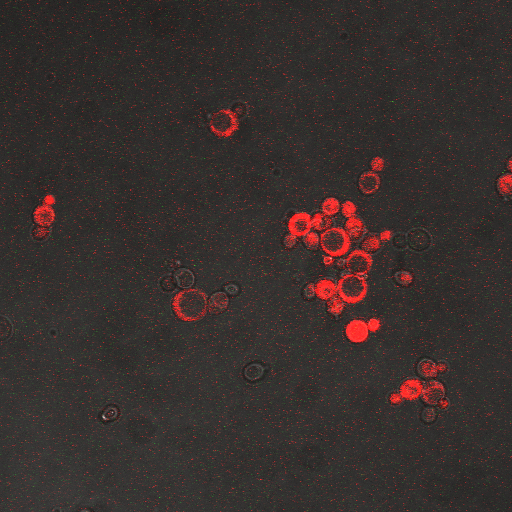
| Having decided on an optimal voltage, we then wanted to optimize the duration of electrostimulation. Additionally, these experiments provided the opportunity to compare yeast with and without functional PMC1 and VCX1 (vesicular calcium pumps). The data support a linear increase in expression of our RFP reporter with increased stimulation time. We also observe much higher expression in cells with vesicular pumps than in those without.
The graph to the left shows a increasing, linear relationship between electrostimulation time and expression of the RFP reporter. |
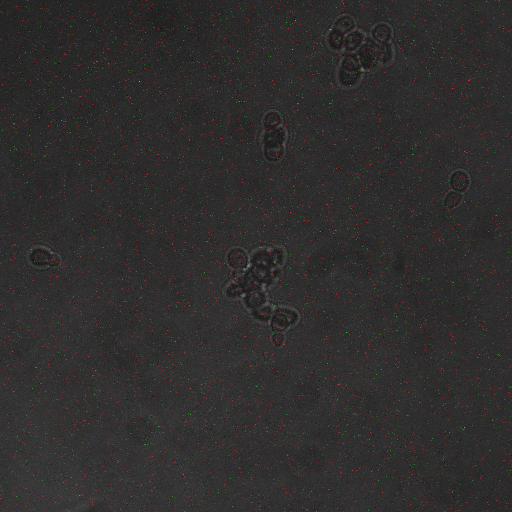
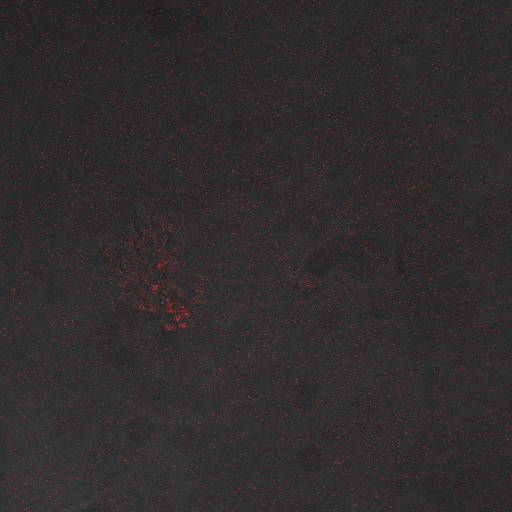
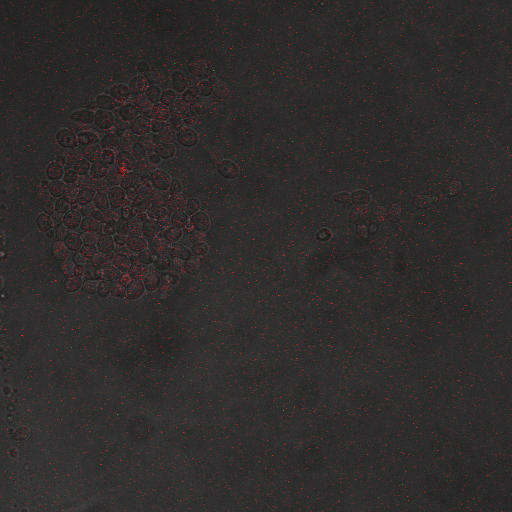
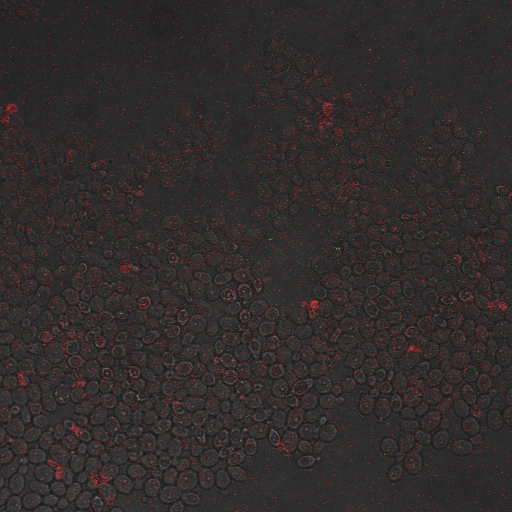
In the images above we observe some constitutive expression of RFP in the FKS2 CDRE strain with the vesicular pumps. However, there is a linear increase in expression of the RFP reporter with increase in electrostimulation time up to 90 seconds.
Again, there is a linear relationship between stimulation duration and RFP reporter expression. However, in this case, the cells lacking vesicular pumps expressed less than those with vesicular pumps.
Quantitative Characterization of FKS2 CDRE and PMC1 CDRE in Vacuole Positive and Negative Yeast
At high time points, we observed that the unstimulated control often expressed as much as experimental samples. We postulated that this was a result of widespread cell death. While we normalized against OD, this can only account for cell density, not cell viability. We also noted that the data point at 40s (and later in one case) is consistently higher than many of the data with longer electrostimulation duration. We believe that this is the same effect. If this is so, it implies that the cell death that we observe is a steplike function of duration.
In this experiment, cells with the FKS2 CDRE and the PMC1 CDRE were grown and passed into two rows of a 96 well plate and shocked at 8V with an exposure time of 0-80 seconds to quantitate the relationship between electrostimulation time and expression of a fluorescent protein. We again investigated the effect of knocking out the PMC1 and VCX1 vesicular calcium pumps. The data for both pump positive and pump negative cells are shown below.
Instrumentation
For more detail please see our device page.
We tried several approaches to electrostimulate our cells with both accuracy and precision, but without widespread cell death. Our approaches are detailed below.
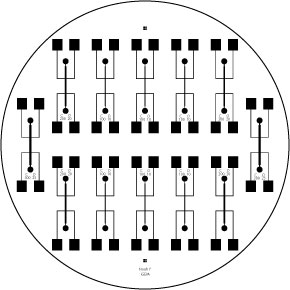
A Microfluidic Chip:
|
A homemade, aluminum foil-based electrode:
Suffice it to say that this device was sufficient for initial, qualitative tests but did not provide the consistency or usability for effective long-term use. Essentially, the device was 8 well plate with aluminum electrodes with a brass backing. This design was quickly abandoned.
An 8 well, gold-plated electrode:
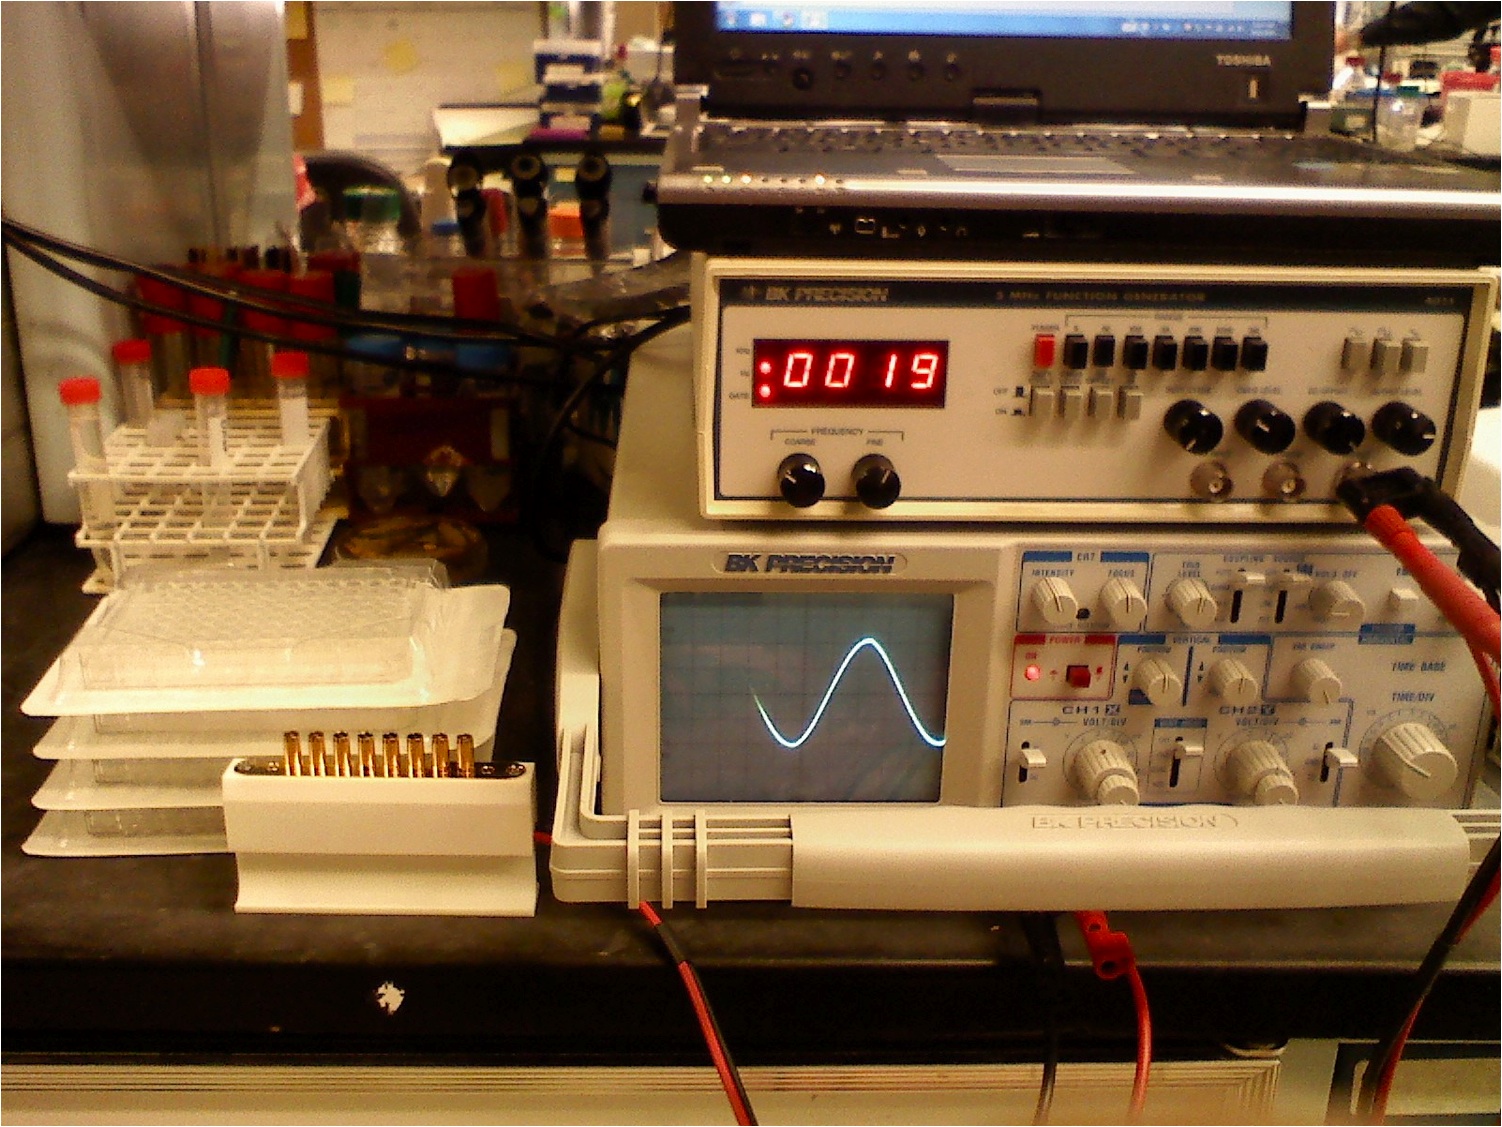
Finally, we have started using a gold-plated coaxial 8 well electroporator to electrostimulate the cells. It has shown excellent results and allows us to do large experiments using 96 well plates. In the image to the left, you can see our complete and final setup.
|
Future Research Plans
- Finish categorizing the synthetic CDREs using our high throughput electrostimulation device.
- Apply our optimized high throughput experimentation technique to a library of synthetic CDRE sequences we have developed to characterize their voltage activation domains. We hope this library might allow others to have a more fine-grained control over the voltage response in their cells.
- Develop a genetic switch utilizing the repressible operator already present on FKS2.
- Develop an iGEM-compatible plasmid for yeast with a yeast-optimized origin of replication and markers. A shuttle vector would also be useful, enabling DNA to be stored or copied in bacteria and quickly transfered for testing in yeast. Our project would not be possible in a prokaryotic chassis. We feel that iGEM's apparent focus on E. coli may hinder the development of parts and systems that require eukaryotic organisms.
References
- Cyert MS. Calcineurin signaling in Saccharomyces cerevisiae: how yeast go crazy in response to stress. Biochem Biophys Res Commun (2003)
- Long Cai, Chiraj K. Dalal & Michael B. Elowitz. Frequency-modulated nuclear localization bursts coordinate gene regulation. Nature (2008).
- Stathopoulos-Gerontides, et al. Yeast calcineurin regulates nuclear localization of the Crz1p transcription factor through dephosphorylation. Genes & Development (1999).
- Yoshimoto et al. Genome-wide analysis of gene expression regulated by the calcineurin/Crz1p signaling pathway in Saccharomyces cerevisiae. J Biol. Chem. (2002).
 "
"

