"
"
Team:Imperial College London/Modelling/Protein Display/Detailed Description
From 2010.igem.org
m (small bug fix) |
m |
||
| Line 41: | Line 41: | ||
The optimal peptide concentration required to activate ComD is 10 ng/ml <a href="http://ukpmc.ac.uk/backend/ptpmcrender.cgi?accid=PMC40587&blobtype=pdf">[1]</a>. This is the threshold value for ComD activation. However, the minimum concentration of peptide to give a detectable activation is 0.5ng/ml. | The optimal peptide concentration required to activate ComD is 10 ng/ml <a href="http://ukpmc.ac.uk/backend/ptpmcrender.cgi?accid=PMC40587&blobtype=pdf">[1]</a>. This is the threshold value for ComD activation. However, the minimum concentration of peptide to give a detectable activation is 0.5ng/ml. | ||
<br /> | <br /> | ||
| - | The threshold for the minimal activation of the receptor is c<sub>th</sub>=4. | + | The threshold for the minimal activation of the receptor is c<sub>th</sub>=4.4658×10<sup>-9</sup> mol/L. Click on the button below to uncover the calculations. |
<div id="wrapper"> | <div id="wrapper"> | ||
| - | <div class="accordionButton">Converting 10 ng/ml to 4. | + | <div class="accordionButton">Converting 10 ng/ml to 4.4658×10<sup>-9</sup> mol/L</div> |
<div class="accordionContent"> | <div class="accordionContent"> | ||
<ul> | <ul> | ||
| - | <li>The mass of a peptide is 2.24kDa = 3. | + | <li>The mass of a peptide is 2.24kDa = 3.7184×10<sup>-21</sup>g.</li> |
| - | <li>The number of molecules in one ml is 10ng/3. | + | <li>The number of molecules in one ml is 10ng/3.7184×10<sup>-21</sup>g = 2.6893×10<sup>12</sup>. In a litre, the number of molecules is 2.6893×10<sup>15</sup>molecules/ml.</li> |
| - | <li>Dividing this value by Avogadro's constant gives the threshold concentration of c<sub>th</sub>=4. | + | <li>Dividing this value by Avogadro's constant gives the threshold concentration of c<sub>th</sub>=4.4658×10<sup>-9</sup> mol/L.</li> |
| - | <li>The threshold for minimal activation of receptor is 2. | + | <li>The threshold for minimal activation of receptor is 2.2329×10<sup>-10</sup> mol/L.</li> |
</ul> | </ul> | ||
</div> | </div> | ||
| Line 86: | Line 86: | ||
Difussion distance was calculated using Fick's 1st Law: x=<var>√</var>2Dt, where: x - diffusion distance, D - diffusion constant, t - time of diffusion | Difussion distance was calculated using Fick's 1st Law: x=<var>√</var>2Dt, where: x - diffusion distance, D - diffusion constant, t - time of diffusion | ||
<br /> | <br /> | ||
| - | D<sub>average</sub> = 10. | + | D<sub>average</sub> = 10.7×10<sup>-11</sup> m<sup>2</sup>s<sup>-1</sup> for a protein in agarose gel for pH=5.6 <a href="http://www.sciencedirect.com/science?_ob=MImg&_imagekey=B6V5N-4B3MXDC-2-K&_cdi=5791&_user=217827&_pii=S1369703X03002377&_origin=search&_coverDate=07%2F01%2F2004&_sk=999809998&view=c&wchp=dGLzVtb-zSkzS&md5=c17d0e7320f03931006f9b1a10a438b9&ie=/sdarticle.pdf">[3]</a> |
<br /> | <br /> | ||
t = 8s (arbitrarily chosen) | t = 8s (arbitrarily chosen) | ||
<br /> | <br /> | ||
| - | This gives: x = 4. | + | This gives: x = 4.14×10<sup>-5</sup>m |
<br /> | <br /> | ||
The control volume can be calculated by adding 2x to the length and the diamter of the cell. | The control volume can be calculated by adding 2x to the length and the diamter of the cell. | ||
<br /> | <br /> | ||
| - | This gives a control volume (CV) = 4. | + | This gives a control volume (CV) = 4.81×10<sup>-7</sup>m<sup>3</sup> |
<br /> | <br /> | ||
</div> | </div> | ||
| Line 118: | Line 118: | ||
<html> | <html> | ||
<br /> | <br /> | ||
| - | The graph shows values of CFU/ml for different optical densities. The range of CFU/ml is therefore between 0. | + | The graph shows values of CFU/ml for different optical densities. The range of CFU/ml is therefore between 0.5×10<sup>8</sup> - 5×10<sup>8</sup>. |
<br /> | <br /> | ||
| - | In this calculation, we assumed that only one cell will grow and become one colony (i.e. no more than one cell will form no more than one colony). Therefore, the maximum number of cells in 1ml of solution is | + | In this calculation, we assumed that only one cell will grow and become one colony (i.e. no more than one cell will form no more than one colony). Therefore, the maximum number of cells in 1ml of solution is 5×10<sup>8</sup>. Taking the volume of 1 ml = 10<sup>-3</sup> dm<sup>3</sup> and dividing by the (maximum) number of cells in 1ml gives the average control volume (CV) around each cell: 2×10<sup>-12</sup> dm<sup>3</sup>/cell. For simplicity, we choose the control volume to be cubic. Taking the third root of this value gives the length of each side of the control volume. |
| - | <p>Side length of CV = y = 1. | + | <p>Side length of CV = y = 1.26×10<sup>-4</sup> dm = 1.26×10<sup>-5</sup> m.</p> |
<b>Choice of Control Volume allows simplifications</b><br/> | <b>Choice of Control Volume allows simplifications</b><br/> | ||
| Line 141: | Line 141: | ||
<br /><br /> | <br /><br /> | ||
<b>Limitations resulting from our assumptions</b><br/> | <b>Limitations resulting from our assumptions</b><br/> | ||
| - | Most of our assumptions concerning the control volume were plausible due to the careful choice of cell density = | + | Most of our assumptions concerning the control volume were plausible due to the careful choice of cell density = 5×10<sup>8</sup> CFU/ml. |
<br /> | <br /> | ||
| - | If the density is varied significantly, then our simplifications might not hold any longer. However, this does not mean that our system cannot function for lower cell densities. Our model might not be very accurate for predicting situations with cell densities that are much higher or lower than | + | If the density is varied significantly, then our simplifications might not hold any longer. However, this does not mean that our system cannot function for lower cell densities. Our model might not be very accurate for predicting situations with cell densities that are much higher or lower than 5×10<sup>8</sup> CFU/ml. |
<br /> | <br /> | ||
It was decided that the model should not be used for cell densities lower 10<sup>7</sup> CFU/ml. Below this value AIPs take more than 1 second to diffuse accross half of a side-length of the control volume (assuming that the cell is inside control volume). We agreed that below 10^<sup>7</sup> CFU/ml the approximation about uniform concentration throughout the control volume could be wrong and that the concentration gradients could become more significant. If our model was applied to this particular situation, it would possibly overestimate the time taken to activate the receptor. | It was decided that the model should not be used for cell densities lower 10<sup>7</sup> CFU/ml. Below this value AIPs take more than 1 second to diffuse accross half of a side-length of the control volume (assuming that the cell is inside control volume). We agreed that below 10^<sup>7</sup> CFU/ml the approximation about uniform concentration throughout the control volume could be wrong and that the concentration gradients could become more significant. If our model was applied to this particular situation, it would possibly overestimate the time taken to activate the receptor. | ||
| Line 151: | Line 151: | ||
<h2>5. Protein production</h2> | <h2>5. Protein production</h2> | ||
<ul> | <ul> | ||
| - | <li>The paper mentions that each cell displays 2. | + | <li>The paper mentions that each cell displays 2.4×10<sup>5</sup> peptides. <a href="http://onlinelibrary.wiley.com/doi/10.1111/j.1574-6968.2000.tb09188.x/pdf">[2]</a></li> |
| - | <li>2. | + | <li>2.4×10<sup>5</sup> molecules = 2.4×10<sup>5</sup>/6.02×10<sup>23</sup> mol = 0.398671×10<sup>-18</sup> mol</li> |
| - | <li>Volume of B.sub: 2. | + | <li>Volume of B.sub: 2.79×10<sup>-15</sup> dm<sup>3</sup></math></li> |
<li>Concentration = [mol/L]</li> | <li>Concentration = [mol/L]</li> | ||
| - | <li>c = 1. | + | <li>c = 1.4289×10<sup>-4</sup> mol/dm<sup>3</sup>. This is the concentration of protein that will be displayed on a single cell of B.sub. |
</ul> | </ul> | ||
<br /> | <br /> | ||
| - | Hence, we can deduce that the final concentration that the protein expression will tend to is: c = 1. | + | Hence, we can deduce that the final concentration that the protein expression will tend to is: c = 1.4289×10<sup>-4</sup> mol/dm<sup>3</sup> = c<sub>final</sub>. |
<br /><br /> | <br /><br /> | ||
Therefore, we can model the protein production by transcription and translation and adjust the production constants so that the concentration will tend towards c<sub>final</sub>. | Therefore, we can model the protein production by transcription and translation and adjust the production constants so that the concentration will tend towards c<sub>final</sub>. | ||
| Line 181: | Line 181: | ||
The previously determined constants of protein production in B.sub to obtain the concentration of proteins are not valid in the Control Volume. It has to be adjusted (multiplied) by the following factor: | The previously determined constants of protein production in B.sub to obtain the concentration of proteins are not valid in the Control Volume. It has to be adjusted (multiplied) by the following factor: | ||
<br /> | <br /> | ||
| - | factor=V<sub>bacillus</sub>/V<sub>CV</sub> = 5. | + | factor=V<sub>bacillus</sub>/V<sub>CV</sub> = 5.7974×10<sup>-6</sup> (for the particular numbers presented above) |
</html> | </html> | ||
<div ALIGN=CENTER> | <div ALIGN=CENTER> | ||
Revision as of 12:28, 22 October 2010


| Temporary sub-menu: Objectives; Detailed Description; Parameters & Constants; Results & Conclusion;Download MatLab Files; |
| Surface Protein Model | ||||||||||
This model consists of 5 parts that had to be developed:
1. Elements of the system
2. Interactions between elementsApart from the proteins being expressed from genes, there was only one more chemical reaction identified in this part of the system. This is the cleavage of proteins, which is an enzymatic reaction:
This enzymatic reaction can be rewritten as partial differential equations (PDEs), which is of similar form as the 1-step amplification model. However, most of the constants and initial concentrations are different. For detailed description and derivation of PDEs, please refer to "Detailed Description" part of Modelling Output. 3. Threshold concentration of AIPThe optimal peptide concentration required to activate ComD is 10 ng/ml [1]. This is the threshold value for ComD activation. However, the minimum concentration of peptide to give a detectable activation is 0.5ng/ml.The threshold for the minimal activation of the receptor is cth=4.4658×10⁻⁹ mol/L. Click on the button below to uncover the calculations. Converting 10 ng/ml to 4.4658×10⁻⁹ mol/L
4. Control volume selectionNote that this enzymatic reaction is modelled outside the cell. Hence, it is important to take into account the cell boundaries. It is worth considering whether diffusion or fluid movements will play a significant role. Initially, we defined a control volume assuming that bacteria would grow in close colonies on the plate. This control volume is considered to be wrong, but the details were kept for reference.Initial Choice of Control Volume
Control volume initial choice
This control volume is considered to be wrong by us, but the details were kept for the reference. The control volume: The inner boundary is determined by the bacterial cell (proteins after being displayed and cleaved cannot diffuse back into bacterium). The outer boundary is more time scale dependent. We have assumed that after mass cleavage of the display-proteins by TEV, many of these AIPs will bind to the receptors quite quickly (eg. 8 seconds). Our volume is determined by the distance that AIPs could travel outwards by diffusion within that short time. In this way, we are sure that the concentration of AIPs outside our control volume after a given time is approximately 0. This approach is not very accurate and can lead us to false negative conclusions (as in reality there will be a concentration gradient, with highest conentration on the cell wall).
We realized that our initial choice of control volume was not accurate because we had assumed that the bacteria was the medium. However, in reality bacteria live in colonies very close to each other. Since our bacteria was meant to be used in suspension we had to reconsider this issue. Using CFU to estimate the spacing between cells CFU stands for Colony-forming unit. It is a measure of bacterial numbers. For liquids, CFU is measured per ml. We already have data of CFU/ml from the Imperial iGEM 2008 team, so we could use this data to estimate the number of cells in a given volume using a spectrometer at 600nm wavelength. The graph below is taken from the Imperial iGEM 2008 Wiki page [4].
Side length of CV = y = 1.26×10⁻⁴ dm = 1.26×10⁻⁵ m. Choice of Control Volume allows simplifications
5. Protein production
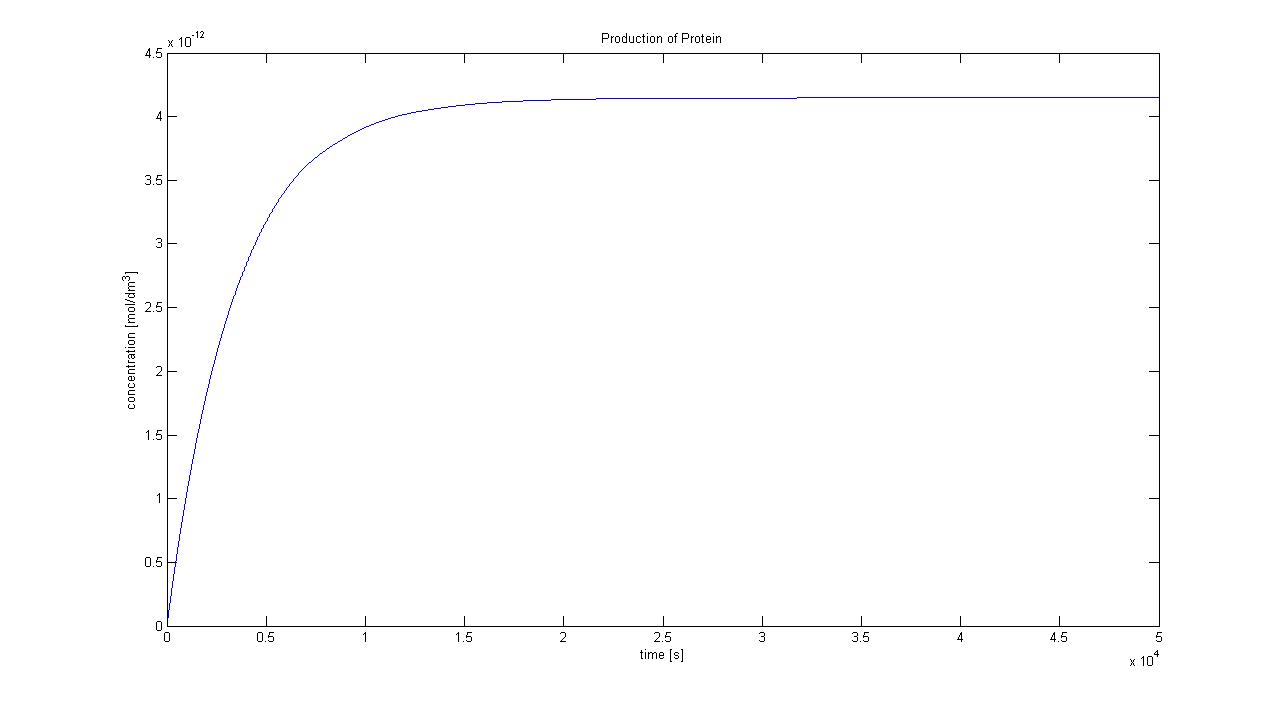
Hence, we can deduce that the final concentration that the protein expression will tend to is: c = 1.4289×10⁻⁴ mol/dm3 = cfinal. Therefore, we can model the protein production by transcription and translation and adjust the production constants so that the concentration will tend towards cfinal. Using a similar model to the simple production of Dioxygenase for the Output Amplification Model (Model preA), we obtain the following graph:
The degradation rate was kept constant, and the production rate was changed according to the final concentration. Protein production in Control VolumeThe previously determined constants of protein production in B.sub to obtain the concentration of proteins are not valid in the Control Volume. It has to be adjusted (multiplied) by the following factor: factor=Vbacillus/VCV = 5.7974×10⁻⁶ (for the particular numbers presented above)
References
|