 "
"
Team:Imperial College London/Modelling/Protein Display
From 2010.igem.org
(Saving progress on the way (editing content) - only results and conclusions left) |
(Finished formatting with some editting. Still need to move pictures. Work on presentation of results. Make the link to MAtlab look good and upload latest versions with instructions of how to use them) |
||
| Line 370: | Line 370: | ||
<div class="accordionButton">Results & Conclusions</div> | <div class="accordionButton">Results & Conclusions</div> | ||
<div class="accordionContent"> | <div class="accordionContent"> | ||
| - | |||
| - | |||
<br /> | <br /> | ||
</html> | </html> | ||
| Line 385: | Line 383: | ||
</div> | </div> | ||
<html> | <html> | ||
| - | + | <br/> | |
| - | < | + | <b>Sensitivity of our model (24/08/2010)</b></br><br/> |
<ul> | <ul> | ||
| - | <li | + | <li>Changing initial concentration of TEV</li> |
| - | + | Whether the threshold concentration of AIP is reached is highly dependent on the initial concentration of TEV. The smallest initial concentration of TEV, [TEV>]<sub0</sub>, for which the threshold is reached is 6.0x10<sup>-6</sup>mol/dm<sup>3</sup>. On the grap below it can be seen that the optimal [TEV]<sub>0</sub> is a concentration higher than 10<sup>-4</sup>mol/dm<sup>3</sup>, which corresponds to the threshold being reached within 1.5 minutes. | |
<br /> | <br /> | ||
</html> | </html> | ||
| Line 402: | Line 400: | ||
|} | |} | ||
</div> | </div> | ||
| - | <html> | + | <html><br/> |
| - | <li | + | <li>Changing the production rate</li> |
| - | + | One order of magnitude change in the production rate results in at least 50s delay of the AIP concentration reaching the threshold concentration.<br/><br/> | |
| - | < | + | <li>Changing production rate</li> |
| - | + | Changing the production rate influences the time duration of the AIP concentration above the threshold level. The higher it is, the shorter the receptor will be activated (at extreme values, AIP concentration does not reach the threshold). However, the production rate has not much influence on how fast the threshold will be reached.<br/><br/> | |
| - | <li | + | <li>Changing control volume</li> |
| - | + | Our model is extremely sensitive to this factor. One order of magnitude change in CV results in several orders of magnitude change in AIP concentration. Hence, special care should be taken in determination of this value. If the model is to be compared with the experimental results, the CFU/ml has to be the same as the one used in the model. Otherwise, the CV has to be readjusted. | |
</ul> | </ul> | ||
| - | + | <br/> | |
| - | < | + | <b>Risk of False positives (31/08/2010)</b><br/> |
It was pointed out that we should assess the risk of false positive activation of the receptor. We are particularly concerned about the display protein not binding to the cell wall, but instead diffusing into the extra-cellular environment. | It was pointed out that we should assess the risk of false positive activation of the receptor. We are particularly concerned about the display protein not binding to the cell wall, but instead diffusing into the extra-cellular environment. | ||
In order to be able to assess the risk of false positives, we need to do further research into the affinity of AIP with attached linker and transmembrane proteins for the receptor as compared to the affinity of the AIP itself for the receptor. | In order to be able to assess the risk of false positives, we need to do further research into the affinity of AIP with attached linker and transmembrane proteins for the receptor as compared to the affinity of the AIP itself for the receptor. | ||
| Line 422: | Line 420: | ||
<li>Knutsen, E., Ween, O. & Havarstein, L. (2003) Two Separate Quorum-Sensing Systems Upregulate Transcription of the Same ABC Transporter in Streptococcus pneumoniae. Journal of Bacteriology. [Online] 186(10), 3078-3085. Available from: http://jb.asm.org/cgi/reprint/186/10/3078 [Accessed 1st September 2010]</li> | <li>Knutsen, E., Ween, O. & Havarstein, L. (2003) Two Separate Quorum-Sensing Systems Upregulate Transcription of the Same ABC Transporter in Streptococcus pneumoniae. Journal of Bacteriology. [Online] 186(10), 3078-3085. Available from: http://jb.asm.org/cgi/reprint/186/10/3078 [Accessed 1st September 2010]</li> | ||
</ol> | </ol> | ||
| + | </div> | ||
| + | |||
| + | <div class="accordionButton">Download: MatLab Files</div> | ||
| + | <div class="accordionContent"> | ||
| + | <a href="http://www.openwetware.org/wiki/Image:Wiki_Model_Protein_Display.txt">Here is the Matlab code for the Matlab simulation</a> | ||
</div> | </div> | ||
Revision as of 22:31, 13 October 2010


| Surface Protein Model | ||||||||||||||||||||||||||
|
Objectives
Motivation for developing that model came from the design process. The idea of having surface protein that could be cleaved and then activate the receptor was very innovatory. However, with this new approach came questions that could not be easily answered. Hence, the following aims were specified:
Detailed Description
This model consists of 5 parts that had to be researched or developed:
1. Elements of the system
2. Interactions between elementsApart from proteins being expressed from genes, there was only one chemical reaction identified in this part of the system. It is cleavage of protein which is an enzymatic reaction:
This results in 4 partial differential equations (PDEs), which is of similar form as the 1-step amplification model. However, most of the constants and initial concentrations are different. For detailed description and derivation of PDEs, please refer to "Detailed Description" part of Modelling Output. 3. Threshold concentration of AIP (20/08/2010)The optimal peptide concentration required to activate ComD is 10 ng/ml [1]. This is the threshold value for ComD activation. However, the minimum concentration of peptide to give a detectable activation is 0.5ng/ml.The threshold for minimal activation of receptor is cth=4.4658x10⁻⁹ mol/L. Click on the button below to uncover the calculations. Converting 10 ng/ml to 4.4658x10⁻⁹ mol/L
4. Control volume selectionNote that this enzymatic reaction is to be modelled outside the cell. Hence, it is important to consider the cell separations. It is worth considering whether the diffusion or fluid movements will play significant role. Initially we defined control volume as if bacteria were growing closely in colonies on the plate. The details can be revealed by clicking on the button below.Initial Choice of Control Volume
Control volume initial choice (23/08/2010)
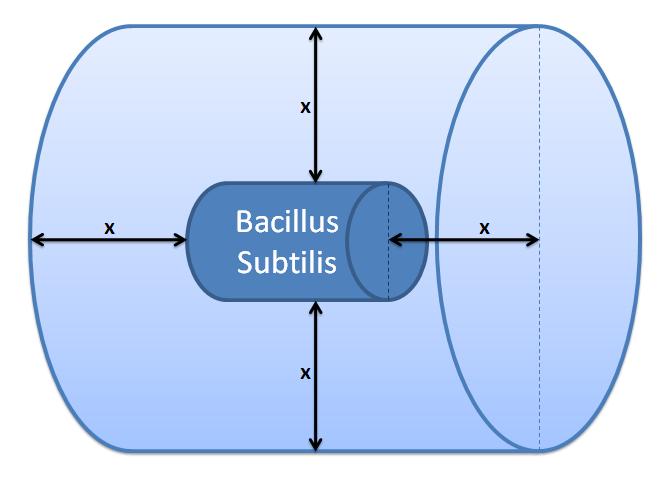
This control volume is considered to be wrong by us, but the details were kept for the reference. The control volume: The inner boundary is determined by the bacterial cell (proteins after being displayed and cleaved cannot diffuse back into bacterium). The outer boundary is more time scale dependent. We have assumed that after mass cleavage of the display-proteins by TEV, many of these AIPs will bind to the receptors quite quickly (eg. 8 seconds). Our volume is determined by the distance that AIPs could travel outwards by diffusion within that short time. In this way, we are sure that the concentration of AIPs outside our control volume after a given time is approximately 0. This approach is not very accurate and can lead us to false negative conclusions (as in reality there will be a concentration gradient, with highest conentration on the cell wall).
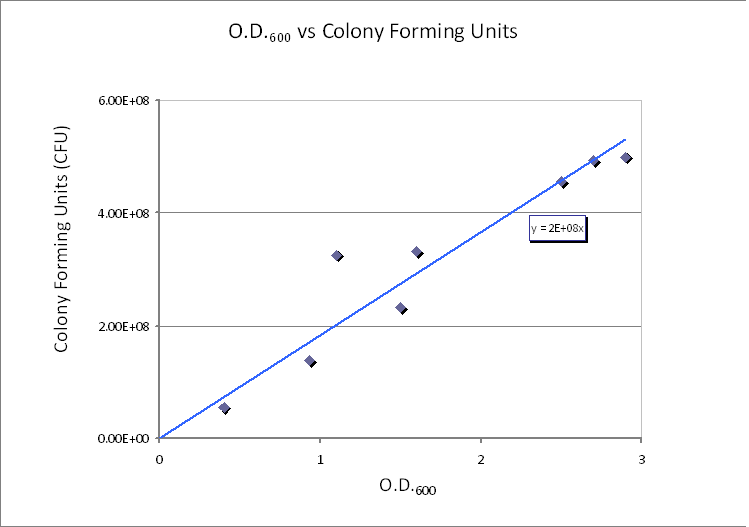
We realized that our initial choice of control volume was not accurate because this assumption was treating bacteria as the medium. However, in reality bacteria live in colonies very close to each other. As a product our bacteria was meant to be used in suspension, so we had to reconsider the issue. Using CFU to estimate the spacing between cells (24/08/2010) CFU stands for Colony-forming unit. It is a measure of bacterial numbers. For liquids, CFU is measured per ml. Since we already have data of CFU/ml from the Imperial iGEM 2008, this is an easy way to estimate the number of cells in a given volume using a spectrometer at 600nm wavelength. The graph below is taken from the Imperial iGEM 2008 Wiki page [4].
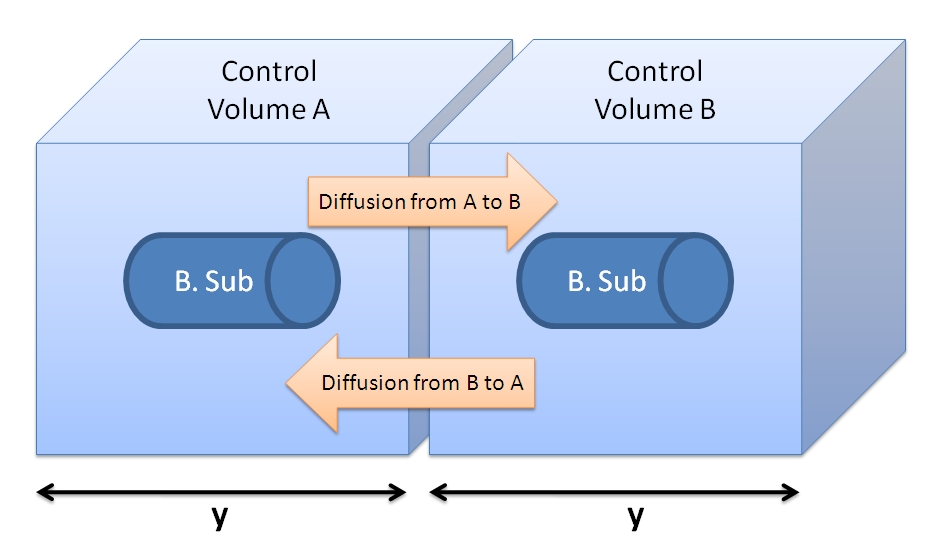
Side length of CV = y = 1.26x10⁻⁴ dm = 1.26x10⁻⁵ m. Choice of Control Volume allows simplifications (24/08/2010)
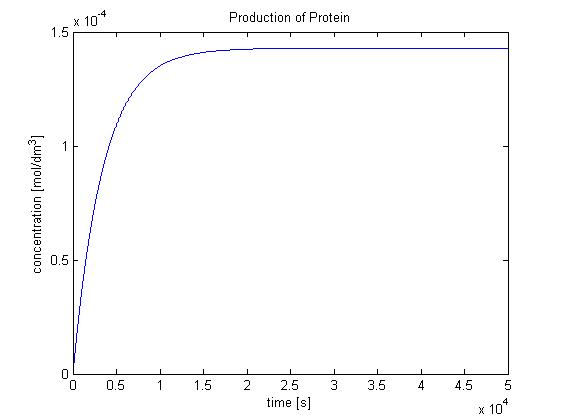
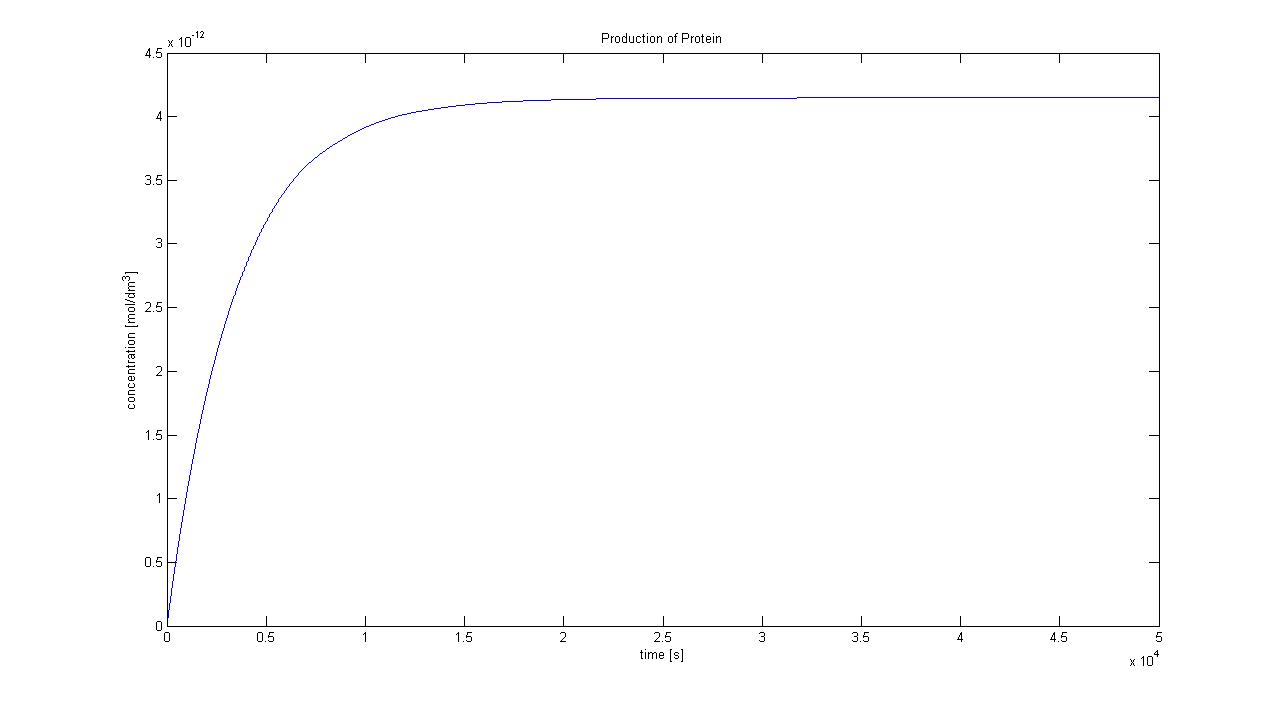
5. Protein production (23/08/2010)
Hence, we can deduce that the concentration that the protein expression will tend to: c = 1.4289x10⁻⁴ mol/dm3 = cfinal. Therefore, we can model the protein production by transcription and translation and adjust the production constant so the concentration value will tend towards cfinal. Using a similar model to the simple production of Dioxygenase for the Output Amplification Model (Model preA), we obtain the following graph:
The degradation rate was kept constant, and the production rate was changed according to the final concentration. Protein production in Control Volume (23/08/2010)The previously determined constants of protein production in B.sub to obtain the concentration of proteins are not valid in the Control Volume. It has to be adjusted (multiplied) by the following factor: factor=Vbacillus/VCV = 5.7974x10⁻⁶ (for the particular numbers presented above)
References
Parameters & Constants
Constants for the Protein Display Model
References
Results & Conclusions
Risk of False positives (31/08/2010) It was pointed out that we should assess the risk of false positive activation of the receptor. We are particularly concerned about the display protein not binding to the cell wall, but instead diffusing into the extra-cellular environment. In order to be able to assess the risk of false positives, we need to do further research into the affinity of AIP with attached linker and transmembrane proteins for the receptor as compared to the affinity of the AIP itself for the receptor. This paper [1] might have some information on affinity comparison. We need to know how proteins are being transported from intracellular to transmembrane space. Understanding this concept could give us an idea of what could go wrong. References
Download: MatLab Files
|
![Graphs showing the simulation using [TEV]<sub>0</sub> = 4x10<sup>-4</sup> mol/dm<sup>3</sup>. The graph on the right hand-side below shows that the AIP threshold (red line) is reached after 22 s.](http://www.openwetware.org/images/7/77/Protein_display.png)
