Team:ETHZ Basel/Modeling/Movement
From 2010.igem.org
Modeling of the bacterial movement
Biological E. coli vs. Electronic E. coli
While the biologists are busy teaching the E. coli how to respond to light, the modelers thought of simulating the light driven E. coli electronically. This will help us check the imaging pipeline, microscope control, light control & joystick control even without actually having biological E. coli under the microscope.
Analogous to the highly complex signal transduction in the Chemotaxis receptor model, there is an equally challenging molecular system on side of the flagella, responsible for the movement of the bacterium.
In analyzing this system, we implemented a probabilistic model, meant to realistically simulate the behavior of the cell, by reproducing the main statistical features of the existing empirical data [1].
The chemotactic movement might employ two states, either running or tumbling. The factor influencing the outcome of the flagellar system is CheYp concentration received as an input from the Chemotaxis pathway at every time point of the simulation.
Statistical Objectives
The purpose of the algorithm we used (described below) was to give very similar statistical results that have been observed in E. coli motility under chemotaxis. These statistics include
Tumbling Angle
[plot Weibull distribution]
The tumbling angle is the change of the direction of the movement of the cell during a tumbling session. According to previous research [1] the tumbling angle behaves according to a Weibull distribution.
Mean Tumbling Length
Run length
Features of the Movement Model
The Bias
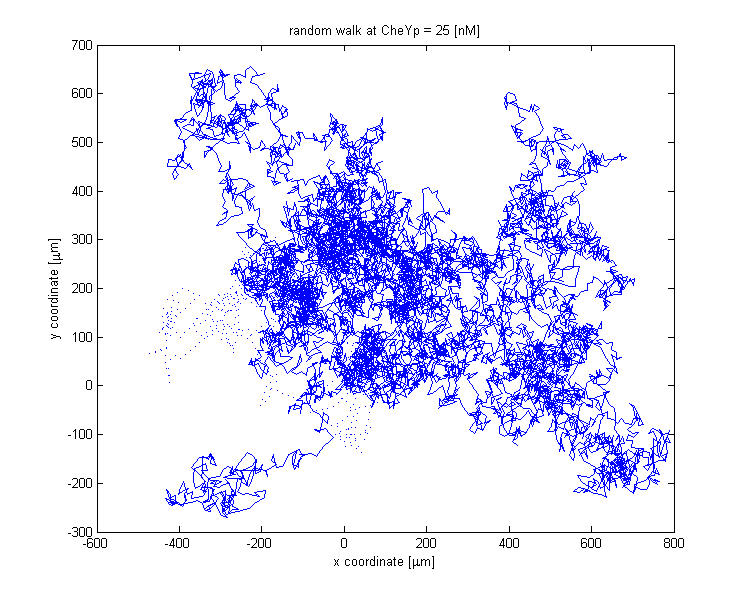
The link between CheYp concentration and the type of movement chosen by the bacterium is called bias and it is formally defined as the fraction of time spent in the running state with respect to the total observation time. Our choice for bias formulation is a nonlinear Hill - type function of the CheYp concentration, with one of the parameters being the CheYp concentration for which a steady - state bias was obtained, well documented from the literature [2]. [NEED FURTHER EXPLANATION!!!]At every time point of the simulation, the cell probabilistically chooses whether to run or to tumble, depending on the bias value. The choice of the running state is equivalent to a change in spatial coordinates, together with a slight change in direction (movement angle), while the choice of the tumbling state corresponds to new movement angle and unchanged spatial coordinates.
During tumbling, the angle change was sampled from a normal distribution, with mean and variance obtained from the literature. [1]
Practical Challenges
One of the biggest practical challenges regarding the movement model was obtaining a time - step - invariant behavior of the cell, whose reliability of statistical estimates should be the same, regardless of how often the cell had to choose its future state. In order to achieve this, we opted for a two - state model, in which the probability of running was controlled separately depending on whether the cell was running or tumbling.
Assumptions
The main assumption of our model was that the mean time in tumbling (mean tumbling length) is constant, while the mean time in running (mean running length) is a function of the bias. This assumption was made in accordance with existent published empirical data analyzing the chemotaxis movement. [citation] The movement velocity was also considered constant [citation]
We derived the two central parameters of our model - the running probabilities - by exploiting the mathematical dependency between the mean run/tumbling length and the running/tumbling probabilities:
[derivation of the probability formulas]
!PENDING!
[1] Chemotaxis in Escherichia coli analysed by three - dimensional Tracking. H.C. Berg, D.A.Brown: Nature 239, 500 - 504. 1972
 "
"


