 "
"
Team:ETHZ Basel/Biology/Implementation
From 2010.igem.org


Biological Implementation
Experimental design
Considering the tremendously hight amount of 81 fusion proteins, we had to assign priorities to the different possibilities. This was made with the various models the dry-lab team implemented in order to help us prioritizing. We had to consider the following parameters. The detailed explanations for our choices you find by clicking on the question itself which is internally linked to the appropriate wiki page:
- Which Che protein should we choose? - We chose CheY as the first target.
- Which anchor would work the best?: TetR was the first choice due to its wide application in synthetic biology and extensive characterization. Our second choice was the ribosome binding domain of trigA
- Which LSP should be fused to the Che protein. PhyB or Pif3?: There was no rational preference which LSP to fuse to the Che protein, so we decided to fuse PhyB to the Che protein.
- Ratio anchor to binding partner: The simulations favored a ratio of 50 µM anchor to 40 µM of anchor binding partner.
Experimental realization
After getting the input from the modeling side concerning experimental design, we had to realize or verify the stated parameters in our biological implementation.
Fusion proteins
First at all, according to the given input, we decided to assemble the following fusion proteins: CheY fused to PhyB as Che-fusion as well as TetR fused to Pif3 and Trigger factor fused to Pif3 as anchor-fusions. As we faced some problems regarding the assembly strategy which we only could fix recently, fusion protein assembly is still in progress. We summarized our experience regarding the assembly method to avoid that other people make the same mistakes and came up with a strategy to link it to Tom Knight`s original assembly method.
While troubleshooting the assembly method we started to implement E. Lemming using our second system: an archeal light receptor fused to E. colis serin transducer (Tsr). And that one actually worked. Check out our first implemented E. Lemming!
Implementation chassis
As we want to change the tumbling frequency of E. lemming by spatial localization of CheY it is important to use a strain for implementation which does not express wild type CheY but only our CheY fusion protein. Therefore, the system will be implemented in a cheY knock out strain which was taken from the KEIO collection [1]. For implementing E. lemming using trigger factor as anchor, we constructed a double knock out tig cheY as all ribosomes should be available to bind the trigger factor fusion protein and not WT trigger factor. This strain was constructed by P1 phage transduction using both strains from the KEIO collection [1].
Ratio between anchor-fusion and CheY-fusion

For the implementation of E. lemming we need to express two fusion proteins simultaneously in one cell. The LSP1 fused to the anchor and the LSP2 fused to the Che protein. To ensure that all Che proteins can be localized, the anchor fusion proteins should be present in slightly higher amounts. The experimental design favored a ratio of 1.5 (50 uM of anchor fusion to 40 uM of Che-fusion). To keep the system as simple as possible we decided to express both proteins from the same type of promotor, the arabinose inducable PBAD promotor. Thus, the only way to adjust the amount of fusion protein expression was by the number of gene copies per cell. We therefore constructed the working vectors based on two different origins of replication (pBB1 and RK2) and measured the actual copy number per cell to verify the optimal ratio of 1.5. For plasmid copy number determination, we prepared plasmid DNA from a known number of cells (OD measurement at 600 nm and correlation of OD600 to colony forming units after plating serial dilutions), measured the obtained amount of DNA (using a commercial Miniprep Kit for extraction an a Nanodrop - which compares the absorbance at 260 nm with an internal standard - for measuring the DNA concentration), and calculated the number of plasmids per cell. All experiments were done in triplicates. The results are shown on the right.
The problem of anchoring places - or how can we be sure, that all anchor-fusions find a place to anchor?
As mentioned above, we chose to implement TetR and trigger factor as anchors for the localization of CheY. For successful anchoring we needed to be sure to provide enough anchor places within one cell for the anchor to bind to. For TetR that means that we have to provide enough tet operator sites where it can bind to. For Trigger factor we need enough ribosomes it can bind to. In both cases this means that we have to provide about 50 µM of anchor places.
Can we provide enough anchor places for TetR?

7 Tet operator sites (sites were TetR bind to on the DNA) were cloned into pUC19 (ori ColE1) and the natural ampicillin resistance of pUC19 was changed to a gentamycin resistance to make it compatible to our working vectors which express an ampicillin resistance and a spectinomycin resistance. To calculate the amount of tet operator sites per cell we determined the copy number of pUC19 and calculated the estimated anchor places. As TetR binds as a dimer to each operator site, 14 TetR can anchor on one plasmid. As we measured to have 267 copies of pUC19 per cells (the measuremnt was performed as described for working vector 1 and 2) we can provide 3867 anchor places per cell. Assuming a cell size of 1 µm this gives about 2.7 µM of anchor places. One possibility to increase the number of Tet operator sites is simply cloning more sites into the pUC vector.
Can we provide enough anchor sites for trigger factor?
Regarding Bionumbers (The Database for useful biological numbers) the number of ribosomes per cell strongly depends on the growth phase and growth rate. In the mid-log phase at a growth rate (per hour) of 1 to 1.5 there are assumed to be 13 500 to 26 500 ribosomes per cell. Given a cell size of 1 µm we end up with 9 - 18 µM of anchor places. As we want to implement E. lemming in a genetic background missing the wild type gene for trigger factor, we can be sure that all ribosomes are free to bind our anchor fusion. Nevertheless the amount of anchor places is still not perfect but regarding the number we are able to provide we think that using trigger factor as anchor might be more promising than using TetR.
Nicely swimming cells under the microscope- not an easy task!
To finally implement E. lemming, we needed to be sure that it would nicely swim and tumble under the lens so we would be able to detect it, track it and guide it by light. Therefore, we tested various growth conditions - minimal media, LB broth, different growth temperatures and growth phases - to find the optimal conditions for imaging E. coli single cells. Furthermore, different bacterial strains were investigated to find the most active one in term of chemotaxis.
The two videos show how the swimming behaviour of E. coli varies with growth conditions.
As a conclusion, growth in in Lysogeny Broth at 30 °C to an OD of about 1.0 of the strain E. coli K12 presented the best microscopic pictures of chemotaxis and these were thus the conditions we applied for our E. lemming.
|
|
|
Functionality assays
Befor implementing the entire system it is important to know if its subparts are functional. So how can we know that CheY fused to PhyB can still perform its function in the chemotaxis pathway? Or how can we be sure that our anchor machanism is really working?
Therefore we came up with some functionality assay to test our constructs:
- Che protein fusion - Chemotaxis assay:
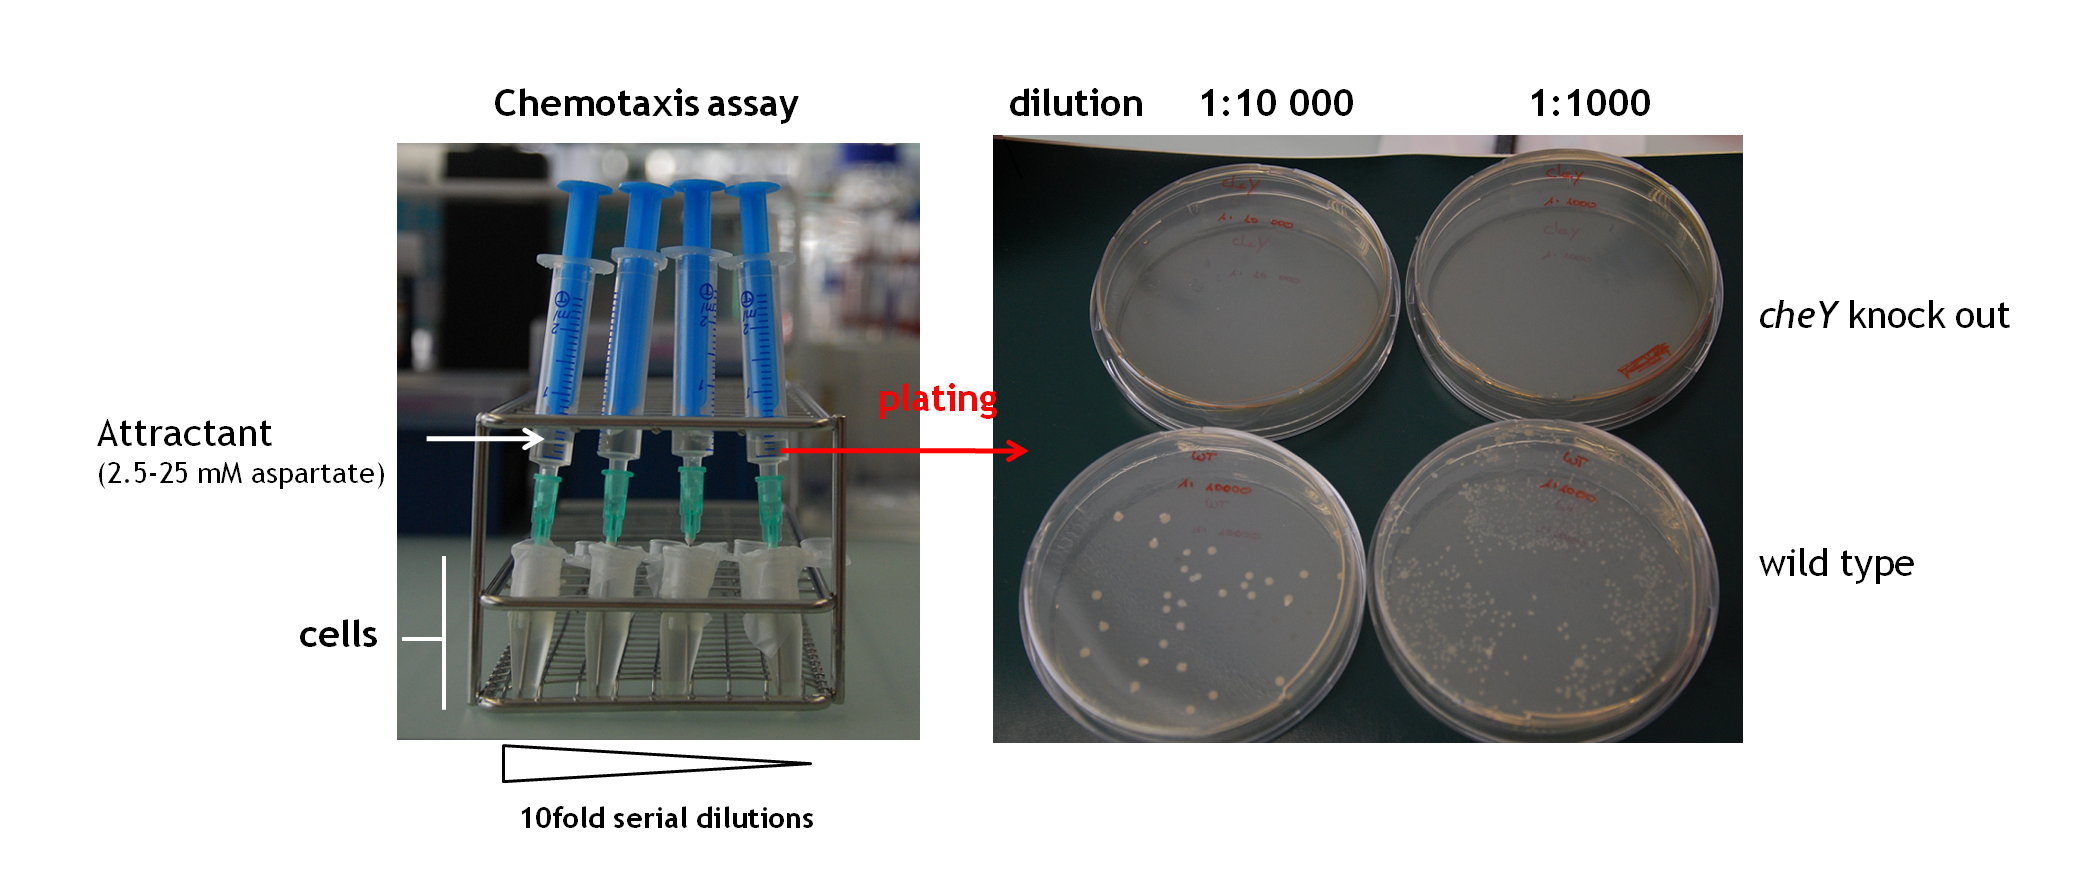 Chemotaxis assay "self made". Cells were grown to an OD600 of 0.3 in LB broth at 30°C and diluted 10-1000fold in 1 ml eppenorf tubes (1 ml total volume). To keep it sterile, the tube was covered with parafilm. A syringe with a 3 cm long needle was filled with a gradient of 2.5-25 mM aspartate (diluted in LB broth) and placed into the eppendorf tube containing the serial dilutions of cells. Afterwards cells were plated on LB agar and colonies were counted.

We put some effort in establishing a chemotaxis assay to check wether or not the expression of a CheY-PhyB fusion could complement for a chromosomal cheY knock out. The assay we tried to established and which is a modified version of [2], which tests if E. coli cells still swim in the direction of an attractant. Therefore cells were grown to an OD600 of 0.3 in LB broth at 30°C and diluted 10-1000fold in 1 ml eppendorf tubes (1 ml total volume). To keep it sterile, the tube was covered with parafilm. A syringe with a 3 cm long needle was filled with a gradient of 2.5-25 mM aspartate (diluted in LB broth) and placed into the eppendorf tube containing the serial dilutions of cells. This setup was incubated for 3 hours at 30 °C before the content of the syringe (not including the content of the needle) was plated onto LB agar plates. Colonies were counted the next day to evaluate how much cells did follow the gradient into the syringe.

- Localizer fusion: The spatial localization of the anchor protein can be investigated by fusing it to a fluorescent protein mCyPet. This fluorescent tag would help to make the binding of the anchor to the plasmid (tetR-tetO), the cell membrane (MreB) or the ribosome (TrigA) visible. For that purpose we designed the BioBrick mCyPet <partinfo>BBa_K422014</partinfo>, which has a distinct fluorescence spectra. Measured at an excitation wavelength of 425 nm with a Fluorescein High Precision Monochromator, maximum emission is detected at 482 nm. The figure on the right shows the relative fluorescence units of mCyPet over a wavelenght range of 460 to 560 nm. As our assembly is still in progress, localization data has not yet been generated.
- PhyB-Pif3 system: Fusing the fluorescent protein mCyPet to PhyB would enable us to visualize not only the light-inducible dimerization (photodimerization) of the phytochrome interaction factor Pif3 to it's photoreceptor PhyB but also the anchoring of the constructs. Furthermore, the reversibility of the dimerization could be investigated. As our assembly is still in progress, localization data has not yet been generated.
Wetlab impressions
Without words...remembering our good (and bad) times in the lab.


