 "
"
Team:Bielefeld-Germany/Results/Characterization/K389016
From 2010.igem.org
(→Data analysis for K389016) |
(→References) |
||
| (5 intermediate revisions not shown) | |||
| Line 26: | Line 26: | ||
== Growth functions and mRFP expression for <partinfo>K389016</partinfo>== | == Growth functions and mRFP expression for <partinfo>K389016</partinfo>== | ||
| - | To characterize this part we performed several cultivations with different concentrations of acetosyringone as inducer and measured the fluorescence emitted by mRFP ([[Team:Bielefeld-Germany/Project/Protocols#Measuring of mRFP | Protocol]]). We used ''Escherichia Coli'' DB3.1 carrying the pSB1C3::K389016 plasmid. Even without inducer the bacteria | + | To characterize this part we performed several cultivations with different concentrations of acetosyringone as inducer and measured the fluorescence emitted by mRFP ([[Team:Bielefeld-Germany/Project/Protocols#Measuring of mRFP | Protocol]]). We used ''Escherichia Coli'' DB3.1 carrying the pSB1C3::K389016 plasmid. Even without inducer the bacteria carrying the plasmid showed decelerated growth. In addition acetosyringone affected the growth rates (we used a stock solution of 20 mM acetosyringone solved in 10 % (v/v) DMSO). Growth curves, averaged specific growth rates and doubling times are shown below. It can be observed, that ''E. coli'' carrying the pSB1C3::K389016 plasmid growths nearly linear. |
| - | [[Image:K389016growth.jpg|600px|thumb|center|'''Fig. 1: Growth | + | [[Image:K389016growth.jpg|600px|thumb|center|'''Fig. 1: Growth curves for ''E. coli'' DB3.1 without plasmid and carrying <partinfo>K389016</partinfo> with different acetosyringone concentrations in LB medium with 10 mg ml<sup>-1</sup> chloramphenicol.''']] |
| - | The specific growth rates µ and doubling times | + | The specific growth rates µ and doubling times t<sub>d</sub> are calculated with the OD<sub>600</sub> and following formulas: |
[[Image:Bielefeld_Specific_growth_rate.jpg|175px|center]] <div align="right">(1)</div> | [[Image:Bielefeld_Specific_growth_rate.jpg|175px|center]] <div align="right">(1)</div> | ||
| Line 68: | Line 68: | ||
| - | Exemplary induction curves with the fluorescence normalized to | + | Exemplary induction curves with the fluorescence normalized to OD<sub>600</sub> are shown in Fig.2. We observed a basal transcription, but the induction with acetosyringone is undoubtedly. The detailed [[#Data analysis for BBa_K389016 | data analysis]] and [[#Transfer function of BBa_K389016 | transfer function]] is described below. |
| - | [[Image:K389016induction.jpg|600px|thumb|center|'''Fig. 2: Induction Curves for ''E. coli'' DB3.1 carrying <partinfo>K389016</partinfo> with different acetosyringone concentrations in LB medium with 10 mg ml<sup>-1</sup> chloramphenicol. The relative fluorescence units are normalized to | + | [[Image:K389016induction.jpg|600px|thumb|center|'''Fig. 2: Induction Curves for ''E. coli'' DB3.1 carrying <partinfo>K389016</partinfo> with different acetosyringone concentrations in LB medium with 10 mg ml<sup>-1</sup> chloramphenicol. The relative fluorescence units are normalized to OD<sub>600</sub> and plotted against the ime in h''']] |
| - | + | ||
==Transfer function of <partinfo>K389016</partinfo>== | ==Transfer function of <partinfo>K389016</partinfo>== | ||
| - | The data for the transfer function was measured and analyzed as [[Team:Bielefeld-Germany/Results/Characterization/K389016#Data analysis for BBa_K389016 | described below]]. | + | The data for the transfer function was measured and analyzed as [[Team:Bielefeld-Germany/Results/Characterization/K389016#Data analysis for BBa_K389016 | described below]]. [http://www.nature.com/nature/journal/v416/n6877/abs/nature726.html Nelson ''et al.'' (2002)] suggest using a dose response function and fitting it with a logistical equation for the data analysis of receptor systems. The data was fitted with a function of the form |
| Line 139: | Line 138: | ||
with the amount of product P, the cell count X and the specific production rate q<sub>P</sub>. | with the amount of product P, the cell count X and the specific production rate q<sub>P</sub>. | ||
| - | RFU is commensurate to the concentration of mRFP (P) and the OD<sub>600</sub> is commensurate to the cell count (X) ( | + | RFU is commensurate to the concentration of mRFP (P) and the OD<sub>600</sub> is commensurate to the cell count (X) ([http://partsregistry.org/Part:BBa_F2620:Experience/Endy/Data_analysis Canton and Labno, 2004]): |
| Line 192: | Line 191: | ||
==Different possible inducers== | ==Different possible inducers== | ||
| - | A list of | + | A list of tested possible inducers for a VirA/G signaling system is shown in tab. 4. These inducers where tested as a mix. The specific production rate of mRFP q<sub>P</sub> measured as described [[Team:Bielefeld-Germany/Results/Characterization/K389016#Data analysis for BBa_K389016 | above]] for the mix did not significantly differ from the synthesis rate of the uninduced system (t-Test, p < 0.005). So none of the possible inducers listet in tab. 4 induce the VirA/G signaling system significantly in the measured concentration range. In tab. 4 the chemical structures of the testet possible inducers are shown, too. Acetosyringone is also in tab. 4 although it was not testet in the inducer mix to show the chemical similarity of the tested possible inducers to the natural inducer of the VirA/G signaling system. |
[[Team:Bielefeld-Germany/Project/Outlook | For more information about the possible inducers click here. ]] | [[Team:Bielefeld-Germany/Project/Outlook | For more information about the possible inducers click here. ]] | ||
| Line 198: | Line 197: | ||
| - | <center> Table 4: | + | <center> Table 4: Tested possible inducers for a VirA/G signaling system and acetosyringone with concentrations and chemical structure that were tested. |
{|cellpadding="10" style="border-collapse: collapse; border-width: 1px; border-style: solid; border-color: #000" | {|cellpadding="10" style="border-collapse: collapse; border-width: 1px; border-style: solid; border-color: #000" | ||
| Line 230: | Line 229: | ||
=References= | =References= | ||
| - | Canton B and Labno A (2004) [http://partsregistry.org/Part:BBa_F2620:Experience/Endy/Data_analysis Data processing of Part BBa_F2620]. | + | *Canton B and Labno A (2004) [http://partsregistry.org/Part:BBa_F2620:Experience/Endy/Data_analysis Data processing of Part BBa_F2620]. |
| - | Chu D, Zabet NR, Mitavskiy B (2009) [http://www.sciencedirect.com/science?_ob=ArticleURL&_udi=B6WMD-4V42JG5-1&_user=10&_rdoc=1&_fmt=&_orig=search&_sort=d&_docanchor=&view=c&_acct=C000050221&_version=1&_urlVersion=0&_userid=10&md5=b6431553217aca1129c5b441f4b78425 Models of transcription factor binding: Sensitivity of activation functions to model assumptions], ''J Theor Biol'' 257(3):419-429. | + | *Chu D, Zabet NR, Mitavskiy B (2009) [http://www.sciencedirect.com/science?_ob=ArticleURL&_udi=B6WMD-4V42JG5-1&_user=10&_rdoc=1&_fmt=&_orig=search&_sort=d&_docanchor=&view=c&_acct=C000050221&_version=1&_urlVersion=0&_userid=10&md5=b6431553217aca1129c5b441f4b78425 Models of transcription factor binding: Sensitivity of activation functions to model assumptions], ''J Theor Biol'' 257(3):419-429. |
| - | Greg Nelson, Jayaram Chandrashekar, Mark A. Hoon, Luxin Feng, Grace Zhao, Nicholas J. P. Ryba & Charles S. Zuker (2002) ''[http://www.nature.com/nature/journal/v416/n6877/abs/nature726.html An amino-acid taste receptor ]'', Nature 416: 199-202. | + | *Greg Nelson, Jayaram Chandrashekar, Mark A. Hoon, Luxin Feng, Grace Zhao, Nicholas J. P. Ryba & Charles S. Zuker (2002) ''[http://www.nature.com/nature/journal/v416/n6877/abs/nature726.html An amino-acid taste receptor ]'', Nature 416: 199-202. |
| - | Pasotti L, Zucca S, Del Fabbro E (2009) Characterization experiment on BBa_J23100, BBa_J23101, BBa_J23118, http://partsregistry.org/Part:BBa_J23101:Experience. | + | *Pasotti L, Zucca S, Del Fabbro E (2009) Characterization experiment on BBa_J23100, BBa_J23101, BBa_J23118, http://partsregistry.org/Part:BBa_J23101:Experience. |
| - | [http://web.plasmidfactory.com/en/service_CGE.html PlasmidFactory] | + | *[http://web.plasmidfactory.com/en/service_CGE.html PlasmidFactory] |
Latest revision as of 00:38, 28 October 2010

Contents |
Characterization of <partinfo>K389016</partinfo>
On this page the experiments and results that lead to the <partinfo>K389016</partinfo> characterization data presented on our characterization page are shown in detail.
Growth functions and mRFP expression for <partinfo>K389016</partinfo>
To characterize this part we performed several cultivations with different concentrations of acetosyringone as inducer and measured the fluorescence emitted by mRFP ( Protocol). We used Escherichia Coli DB3.1 carrying the pSB1C3::K389016 plasmid. Even without inducer the bacteria carrying the plasmid showed decelerated growth. In addition acetosyringone affected the growth rates (we used a stock solution of 20 mM acetosyringone solved in 10 % (v/v) DMSO). Growth curves, averaged specific growth rates and doubling times are shown below. It can be observed, that E. coli carrying the pSB1C3::K389016 plasmid growths nearly linear.

The specific growth rates µ and doubling times td are calculated with the OD600 and following formulas:


| E. coli DB3.1 | µ / h-1 | td / h |
|---|---|---|
| without plasmid | 0.35 | 1.98 |
| carrying K389016 | 0.27 | 2.57 |
| carrying K389016 with 150 µM acetosyringone | 0.25 | 2.77 |
| carrying K389016 with 1000 µM acetosyringone | 0.23 | 3.01 |
Exemplary induction curves with the fluorescence normalized to OD600 are shown in Fig.2. We observed a basal transcription, but the induction with acetosyringone is undoubtedly. The detailed data analysis and transfer function is described below.

Transfer function of <partinfo>K389016</partinfo>
The data for the transfer function was measured and analyzed as described below. Nelson et al. (2002) suggest using a dose response function and fitting it with a logistical equation for the data analysis of receptor systems. The data was fitted with a function of the form

with the Hill coefficient p, the bottom asymptote A1, the top asymptote A2 and the switch point log(x0). Figure 3 shows the measured normalized specific production rates qP,n (eq. 8) plotted against the logarithm of the concentration of the inductor acetosyringone in µM. The fit has an R2 = 0.99.

The important data from the transfer function is summarized in table 2:
| Parameter | Value |
|---|---|
| Hill coefficient | 1.673 |
| Switch point | 26.5 µM |
| Top asymptote | 2.62 |
So the fully induced VirA/G signaling system has a 2.6 fold increased expression compared to the uninduced system. The Hill coefficient is > 1, so a positive cooperation can be observed (D Chu et al., 2009). The switch point of the system is at about 25 µM, so this is the concentration at which the device output is 50% of the maximum output.
Data analysis for <partinfo>K389016</partinfo>
The data analysis is made in three steps. First step is the processing of the fluorescence raw data gained by the fluorescence plate reader for every sample:
In the second step the RFUcorrected of every sample is plotted against the cultivation time it was drawn. The data is fitted by an exponential fit of the following style:
The accumulation of mRFP in the cells is always exponential. A typical fitted product accumulation curve is shown below:

The product accumulation in a cultivation can be described as:

with the amount of product P, the cell count X and the specific production rate qP.
RFU is commensurate to the concentration of mRFP (P) and the OD600 is commensurate to the cell count (X) (Canton and Labno, 2004):
With these assumptions it is possible to calculate the specific production rate of mRFP qP in the third step: the specific production rate for every sample of a cultivation is calculated by the derivation of the exponential fit line which describes the accumulation of product in the culture (dRFU/dt) and the measured OD600 data:

The specific production rates qP of all samples of all cultivations made with a specific inductor concentration c are averaged and normalized against the specific production rate of the uninduced system qP,0:

This normalized specific production rate we calculated is commensurate to relative promotor units (RPU) which is commensurate to PoPS (polymerase per seconds) (Canton and Labno, 2004; Pasotti et al., 2009):
Plasmid conformation analysis
A plasmid conformation analysis for the BioBrick <partinfo>K389016</partinfo> in <partinfo>pSB1C3</partinfo> was performed by the PlasmidFactory by Capillary Gel Electrophoresis (CGE). The chromatogram is shown in fig. 5 and the results in tab. 3. The data shows a high percentage of covalently closed circular (ccc) plasmid DNA. This is the biological active shape of plasmids so a high percentage of ccc plasmid DNA indicates a high quality of plasmid DNA (PlasmidFactory).

| Conformation | Ratio / % |
|---|---|
| ccc monomer | 91.2 |
| ccc dimer | 3.2 |
| oc | 5.6 |
Different possible inducers
A list of tested possible inducers for a VirA/G signaling system is shown in tab. 4. These inducers where tested as a mix. The specific production rate of mRFP qP measured as described above for the mix did not significantly differ from the synthesis rate of the uninduced system (t-Test, p < 0.005). So none of the possible inducers listet in tab. 4 induce the VirA/G signaling system significantly in the measured concentration range. In tab. 4 the chemical structures of the testet possible inducers are shown, too. Acetosyringone is also in tab. 4 although it was not testet in the inducer mix to show the chemical similarity of the tested possible inducers to the natural inducer of the VirA/G signaling system.
For more information about the possible inducers click here.
| Inducer | Concentration / µM | Chemical structure |
|---|---|---|
| Capsaicin | 200 | 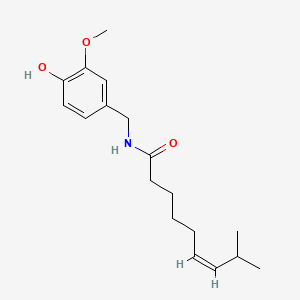
|
| Dopamine | 200 | 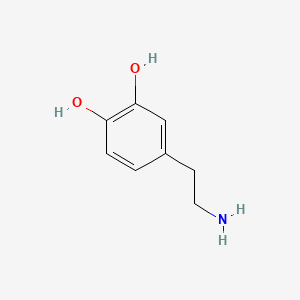
|
| Homovanillic acid | 200 | 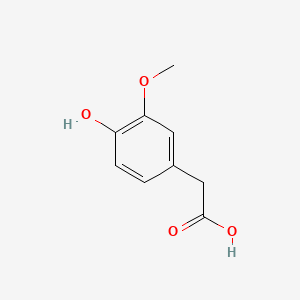
|
| 3-Methoxytyramine | 200 | 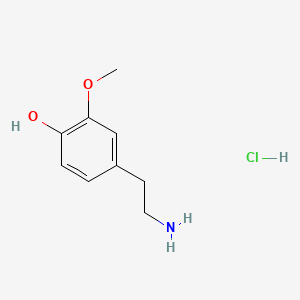
|
| Acetosyringone | 200 | 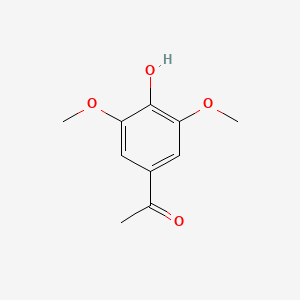
|
References
- Canton B and Labno A (2004) Data processing of Part BBa_F2620.
- Chu D, Zabet NR, Mitavskiy B (2009) Models of transcription factor binding: Sensitivity of activation functions to model assumptions, J Theor Biol 257(3):419-429.
- Greg Nelson, Jayaram Chandrashekar, Mark A. Hoon, Luxin Feng, Grace Zhao, Nicholas J. P. Ryba & Charles S. Zuker (2002) An amino-acid taste receptor , Nature 416: 199-202.
- Pasotti L, Zucca S, Del Fabbro E (2009) Characterization experiment on BBa_J23100, BBa_J23101, BBa_J23118, http://partsregistry.org/Part:BBa_J23101:Experience.