 "
"
Team:Aberdeen Scotland/Probability
From 2010.igem.org
University of Aberdeen - ayeSwitch
Parameter Space Analysis
What is the Likelihood of our Switch Working?
Recall that the equations of our system are as follows:

We wrote a program which takes the equations for our system, calculates the nullclines and records whether or not bistability is achieved. Whether or not bistability is achieved depends strongly on the parameters λi, Ki, μi and ni.
The values for the parameters λi, Ki and μi were taken from literature[1]-[13] but have a large uncertainty attached to them. To take this uncertainty into account we selected each parameter value randomly from a range of two orders of magnitude around the literature value for each parameter. We knew that n1=1 and estimated n2 to be between 1 and 5. Therefore, we ran the program for various combinations of Hill coefficients between 1 and 5. Each time the program was run, the Hill coefficients remained constant but the other parameters varied.
Choosing the parameters in this way meant that each time the program was run we would sometimes achieve a combination of parameters that allowed bistability, and sometimes not.
The program was run 100 times and the number of times bistability was achieved was output to the screen as a percentage. This percentage indicated how probable it was that our system would perform under those conditions.
We then decided to run the program for various different parameter ranges. We cannot change individual parameters specifically, but in the lab it is possible to vary the order of magnitude of a parameter. We wanted to know, if we varied our parameters and Hill coefficients, what is the best percentage we can possibly get? These results are shown in scenarios 2-4.
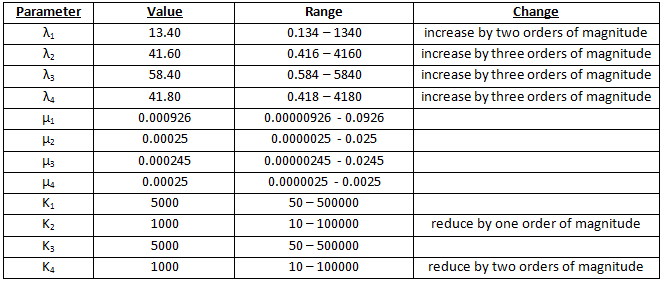
Scenario 1 – unmodified parameters
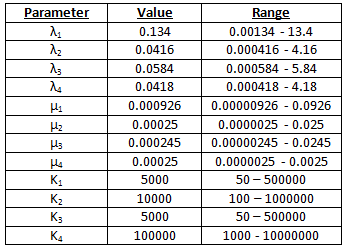
These parameters were taken from, or derived from, the information contained within various sources of literature[1]-[13]. The parameters were converted from concentrations to numbers of molecules.
We did not know what concentration of galactose and methionine was optimal, so we ran various tests and found the value for which the percentages were maximised. We found that the optimal percentages occurred if we have 100000 times more galactose than methionine. See table 1.
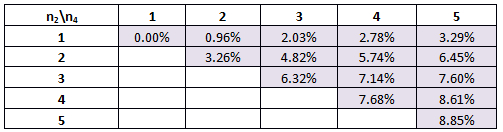
Table 1. The percentage of times our system will work for various combinations of Hill coefficients for the original parameters. n1 is the Hill coefficient for the GFP rate-reaction equation and n2 is the Hill coefficient for the CFP rate-reaction equation.
Here we can see that if n1=1, which is suggested in the literature, then the best scenario we can hope for is that n2=5. In this situation, 3.29% of the parameter ranges tested will give bistability and the possibility of switching.
Scenario 2 – modified parameters 1
Percentages are maximised if we have 100000 times more galactose than methionine. See table 2.
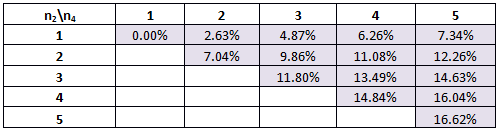
Table 2. The percentage of times our system will work for various combinations of Hill coefficients for the modified parameters.
The best scenario is if we have n1=5 and n2=5.
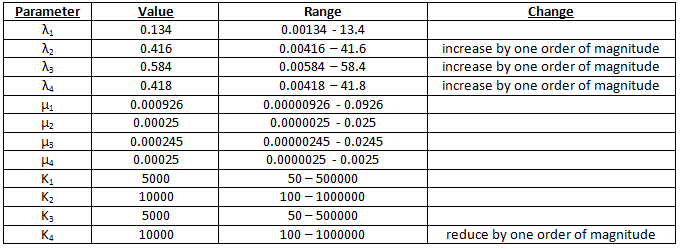
Scenario 3 – modified parameters 2
Percentages are maximised if there is 100000 times more galactose than methionine. See table 3.
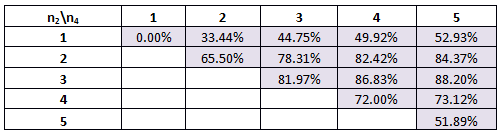
Table 3. The percentage of times our system will work for various combinations of Hill coefficients for the modified parameters.
Here we find that the optimal scenario is n1=3 and n2=5. The trend which has developed in this table will be discussed at the end of scenario 4.
Scenario 4 – modified parameters 3
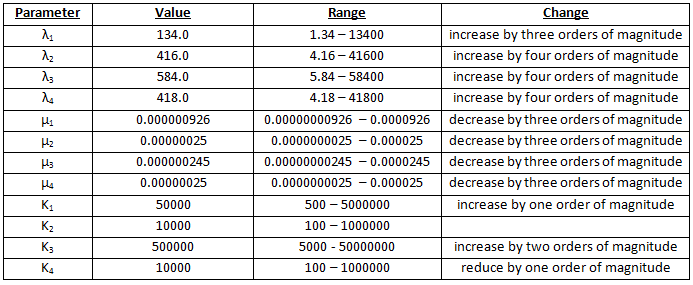
Percentages are maximised if we have 10000000 times more galactose than methionine. See table 4.
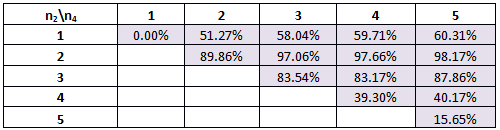
Table 4. The percentage of times our system will work for various combinations of Hill coefficients for the modified parameters.
An interesting trend is seen in scenarios 3 and 4. The percentages increase to a maximum at n1=2 and n2=5 (n1=3 and n2=5 in scenario 3) and then decrease, quite rapidly, towards Hill coefficients of n1=5 and n2=5. In the parameter space, there is a region where bistability is possible. For the smaller Hill coefficients, the randomly chosen parameters (as described above) would allow the nullclines to have a shape such that they would cross three or more times and bistability is achieved. The higher Hill coefficients, however, for the same range of parameters, would have nullclines which were shaped so that they did not cross three or more times – in parameter space, they fall outside the region of bistability.