Team:Stockholm/16 August 2010
From 2010.igem.org
Revision as of 16:51, 16 August 2010 by AndreasConstantinou (Talk | contribs)
Contents |
Andreas
Site-directed mutagenesis
Gel verification
Continued from 13/8 colony PCR amplifications
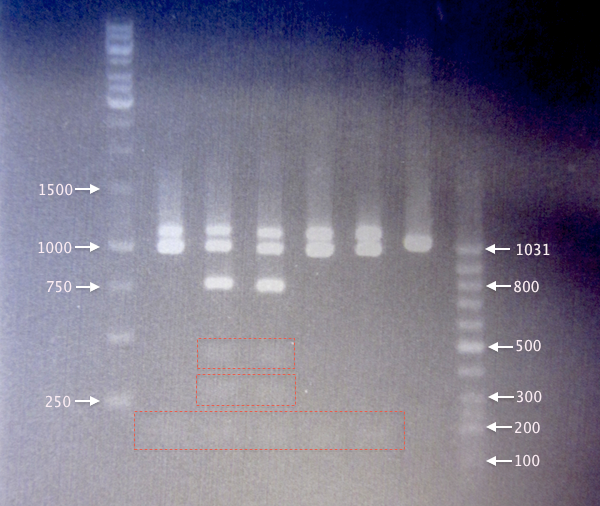
- Digested yCCS samples.
- 1 % agarose; 90 V, 20 min; 70 V, 40 min.
- 3 μl DNA ladder, 3 μl sample.
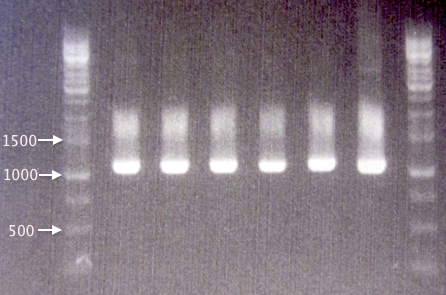
- Undigested yCCS samples.
- 1 % agarose, 70 V, 50 min.
- 3 μl DNA ladder, 3 μl sample.
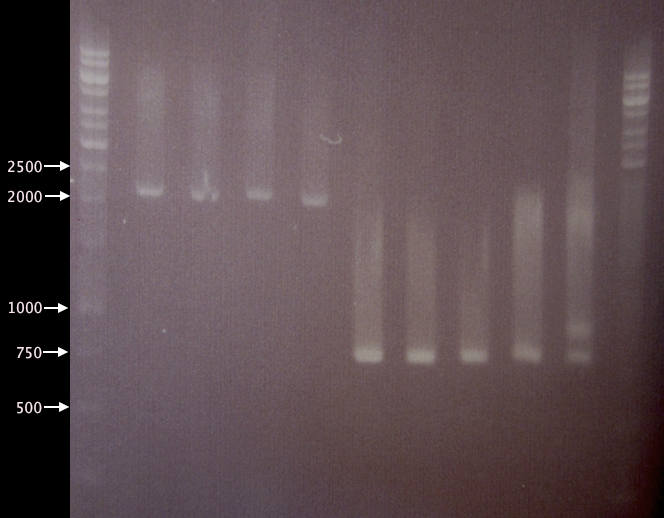
- SOD samples.
- 1 % agarose, 80 V, 1h 10 min.
- 3 μl DNA ladder, 3 μl sample.
Expected bands:
- Undigested yCCS: 1076 bp
- Digested yCCS
- Non-mutagenized: 124 bp, 259 bp, (377 bp), 705 bp, (958 bp), 1076 bp
- Mutagenized (EcoRI site removed): 124 bp, 958 bp, 1076 bp
- SOD: 791 bp
- Pos. control (BBa_J18932): 1037 bp
Parenthesized number denote partly digested products. Underlined numbers denote undigested products.
Results
- Digested yCCS samples. It seems like SA2 and SA3 origin from non-mutagenized clones, as they result in 6 bands. In contrast, SA1, SA4 and SA5 result in three bands.
Band sizes are slightly larger than expected for all digested samples. This may be the result of something influencing the DNA migration speed, possibly the restriction enzymes or the FD green buffer salts. - Undigested yCCS samples. Bands corresponding well to expected sizes of undigested yCCS (1076 bp). Also, the positive control, BBa_J18932, resulted in a slightly smaller band, as expected (1037 bp).
Results from 1. and 2. together indicate successful mutagenesis/EcoRI removal and verified clones for yC1, yC4 and yC5. - SOD samples. Since clones SA1-SA4 were not even supposed to grow on Amp plates, it is quite puzzling that these clones resulted in bands using verification primers pSB-VF2 and pSB-VR; this indicates that these cells probably carry BioBrick plasmids.
Clones SC1-SC5 all results in bands of ≈740 bp, which is smaller than expected (791 bp). SC5 also displays a second band at about 850 bp. However, I was unable to verify any of the picked SOD clones.
Colony PCR
Four new colonies (S1-S4) were picked from the 12/8 SOD plates for verification by colony PCR. The pSB1C3.SOD A plasmid was used as positive control, as it is the plasmid sample used for site-directed mutagenesis.
Procedures as described in colony PCR protocol. Elongation time: 1:30.
Gel verification
1 % agarose, 90 V, 50 min.
 "
"


