Team:Tokyo Metropolitan/Notebook/Pattern/2010/08/25
From 2010.igem.org

E.coli Pattern Formation Project Notebook
|
|
|
||||||||||||||||||||||||||||||||||||||||||||||||||||||||||||||||||||||||||||||||||||||||||||||||||||||||||||||||||||||||||||||||||||||||||||||||||||||||||
Contents |
2010/08/25
1:PCR
<Member>
Mariko, nito
<Sample>
・E-coli (having BBa_I13521 plasmid)
・E-coli (having BBa_K208017 plasmid)
・E-coli (having BBa_I732901 plasmid)
<Protocol>
See Protocol 1
・Tube(higher temperature/lower temperature in annealing)
- Promoter~signal (75.0℃/72.0)
- cyaA (76.5/75.0)
- mRFP~Terminator (72.5/71.0)
- Promoter (76.5/75.0)
- RBS~signal (76.5/75.0)
- lacZ (71.0/68.0)
- Terminator (71.0/68.0)
- CRP (72.5/71.0)
Total 16 tubes.
2: DNA extraction
<Member>
Mariko, nito, Hitomi
<Sample>
・PCR products
<Protocol>
See Protocol 4
3:DNA concentration measurement
<Member>
Mariko, nito, Hitomi
<Sample>
・PCR products
<Protocol>
- Add 2µl of TE and 2µl of sample into the tube, and mix it gently.
- Fall in drops 1 on the measuring machine.
<Result>
| concentration | A320 | A260/A280 | A260/A230 | |
|---|---|---|---|---|
| 1H | 165.0 | 0.142 | 1.886 | 0.821 |
| 1L | 156.0 | 0.097 | 1.891 | 0.556 |
| 2H | 13.5 | 0.059 | 1.868 | 0.341 |
| 2L | 15.4 | 0.056 | 2.007 | 0.031 |
| 3H | 0.7 | 0.55 | -3.500 | 0.004 |
| 3L | -4.8 | 1.02 | 1.484 | -0.025 |
| 4H | 10.0 | 0.055 | 1.905 | 0.035 |
| 4L | 9.9 | 0.157 | 1.913 | 0.019 |
| 5H | -41.0 | 9.39 | 1.464 | 3.475 |
| 5L | 0.9 | 0.322 | 0.818 | 0.004 |
| 6H | -36.0 | 5.55 | 1.636 | 0.321 |
| 6L | 4.5 | 0.86 | 2.282 | 0.050 |
| 7H | -29.5 | 6.07 | 1.439 | 2.070 |
| 7L | -14.2 | 2.24 | 1.497 | -0.062 |
| 8H | 29.5 | 0.169 | 1.934 | 0.051 |
| 8L | 26.5 | 0.081 | 1.978 | 0.038 |
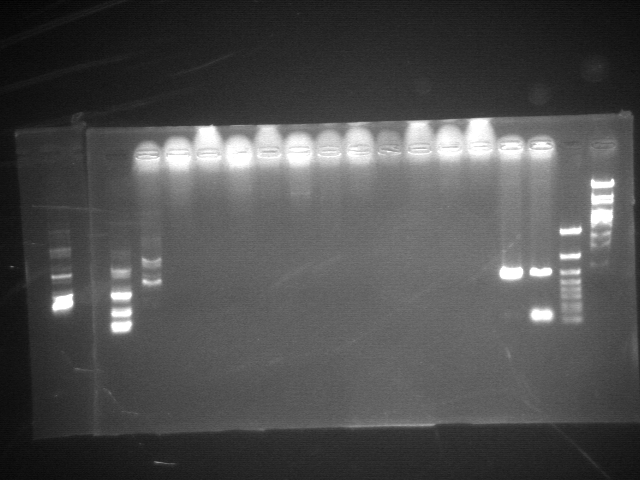
4: Electrophoresis
<Member>
Mariko, nito, Hitomi
<Sample>
・PCR products
<Protocol>
See Protocol 8
 "
"
