Team:TU Delft/Project/rbs-characterization/characterization
From 2010.igem.org

Characterization
By varying only the RBS sequence in a protein generator construct the dependence of the protein expression level on the RBS sequence could be determined by simple fluorescence and biomass curve analysis. The methods are further explained below.
What is RBS strength, really ?
In the field of synthetic biology the 'strength' of an RBS is defined as the rate at which translation is initiated by the RBS sequence on any given mRNA molecule. Going back a step, we see that translation initiation occurs preferentially at certain mRNA sequences, which show a similarity to the consensus -Shine-Delgarno- sequence. This is due to the optimal binding of the 16S rRNA at these regions. In other words, the RBS 'strength' may loosely be defined as the rate of ribosome binding to any given mRNA molecule. (Click here for more information.)
For our project it is not directly the binding equilibria of ribosome to mRNA that is of interest to us, but rather the netto rate of protein production. Thus, in our experimentation we define the RBS strength as the production rate of a given protein downstream of an RBS.
The experiment
The E.coli strains carrying the parts to be tested were cultured for 16 hours on 96-well plates while measuring fluorescence of GFP and biomass absorbance at 10 minute intervals. Click here for the more detailed protocol.
Data normalization method
To go from the raw measurements to the RBS strengths, we ran the following steps using a matlab script:
the plate reader data consists of 8 rows, each containing multiples of 12:
- 5 strains with Anderson RBSs to be characterized
- B0032 strain to compare to
- I13401 strain as control (GFP-dT without promotor and RBS)
- LB+Amp as blank
To prepare the data for further calculation, the following was done:
- Subtract the blank GFP and OD values from the data of wells containing E coli. This takes care of any background noise caused by the LB medium.
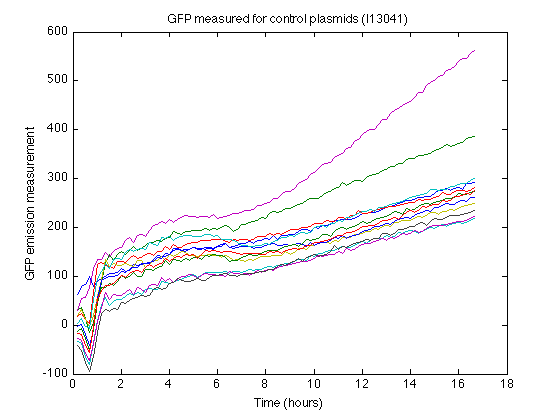
- The strain containing I13401 produces some nonzero measurements (See right). From this control strain measurements we can calculate how much autofluorescence is reported due to biomass or due to leaky expression.
- For each well, we calculate the GFP that is not a result of biomass or leaky expression:
- These values are curve fitted into our protein production model, described in the In Silico section. This results in a (exponential phase) protein production rate for each plate reader well. These production rates are then averaged and compared to the B0032 reference RBS to produce our resulting RBS strengths.

 "
"

