Team:Panama/28 July 2010
From 2010.igem.org
===July 28===
Electrophoresis of the digested parts:
In order to visualized the digested parts we load the samples in a 4% 3:1 Agarose gel(Amresco, Cat no: 9012-36-6)
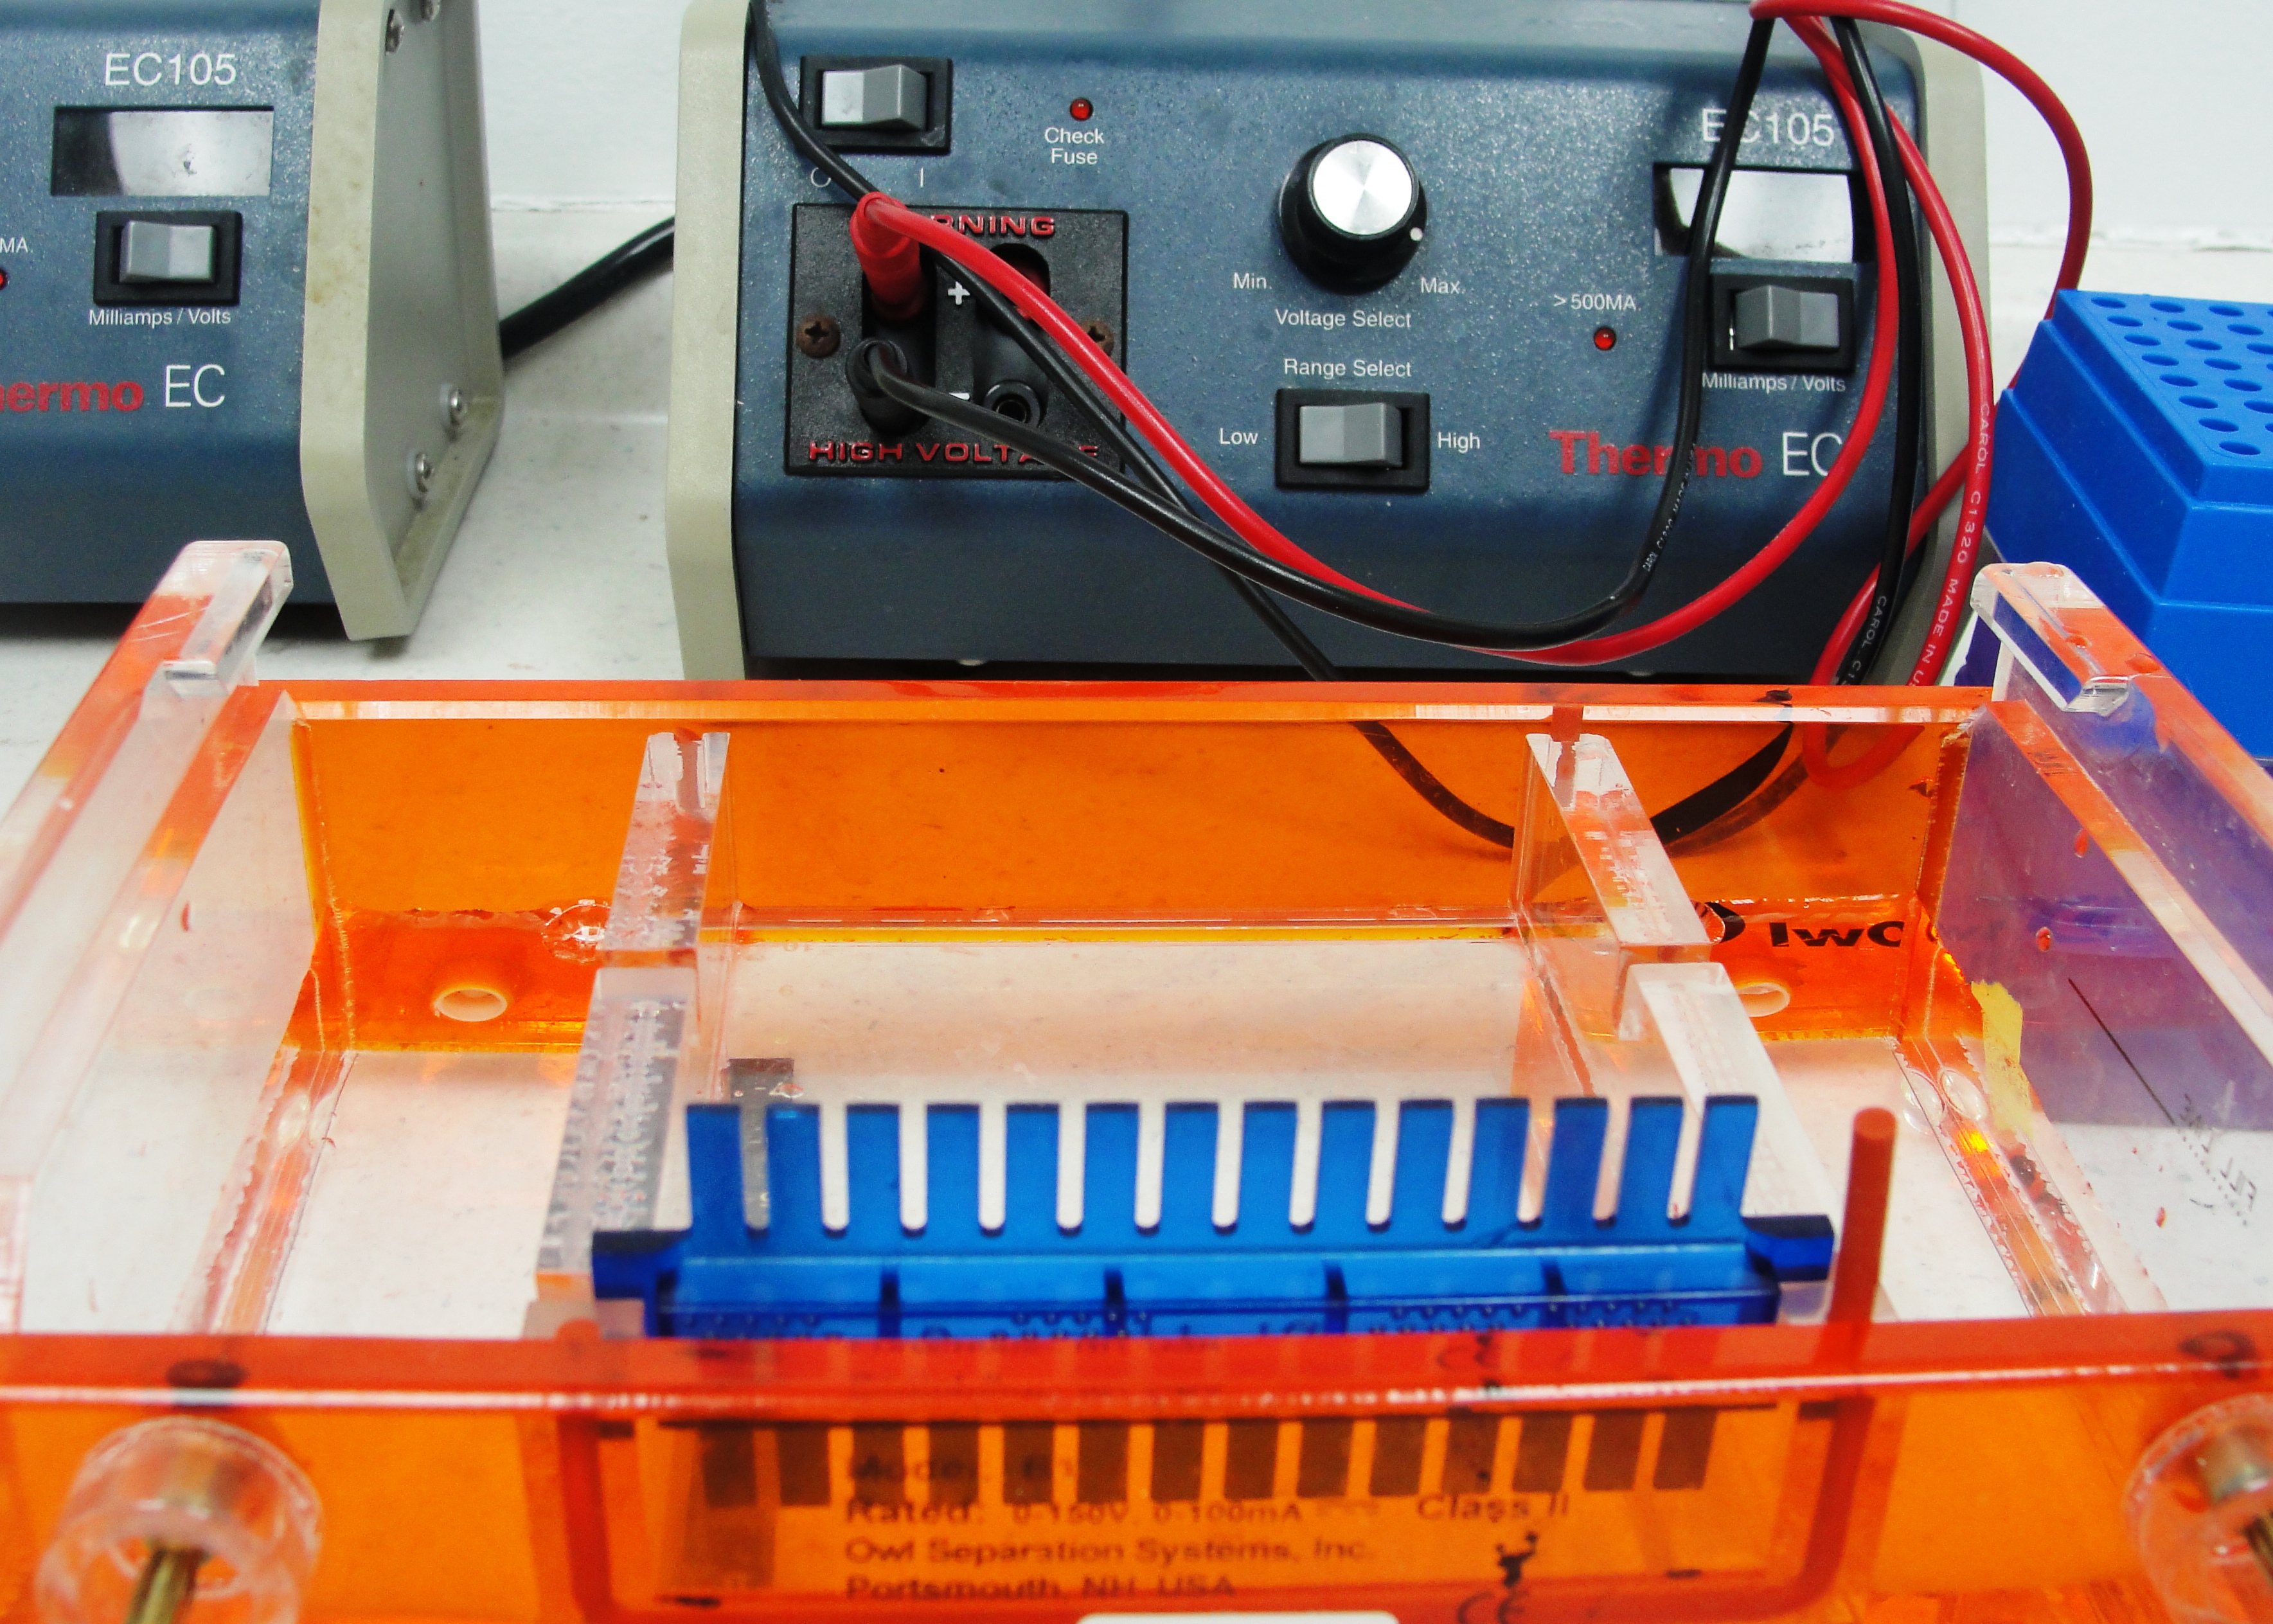
4g of agarose were disolved in 100ml TBE using heat. At first, the mixture is opaque but as the agarose disolves, the mixture becomes clear. At this point we add 5ul of Ethydium bromide. This can then be poured into the casting chamber.
Agarose gel:
Once the gel was set, in each well we load 20 ul of sample, plus 2ul of loading buffer. Total volume = 22ul.
The molecular weight marker that we used was the 25 bp DNA step ladder, G451A.
Application sample order on the agarose gel: M (for the marker), 2 (plasmid), 3 (promoter) & 4 (RBS)
Results:
We could visualize the DNA bands on the agarose gel but, these correspond to the entire plasmid and not the inserted DNA.
Transformation of E. coli using the part terminator.
For this transformation we followed the BioBrick protocol. We took 2 ul of the resuspended DNA stock that was stored at -20 and did a transformation with heat shock.
We tried to run another gel with a different concentration of agarose to see if the reason that we can't see the insert bands was because of the gel.
Agarose Gel 2% (3:1) Amresco -100 ml TBE 1x -2 g Agarose
We could visualize the DNA bands on the agarose gel but these correspond to the entire plasmid and not the inserted DNA.
The restriction digestions were not successful, here are the possible reasons:
1) Exists the possibility that the enzymes use for the restriction do not work adequately (possibly weren't kept at the correct temperature during shipment). "The digestion did not occur"
2) The molecular weight marker that we used (Amresco G451A 25bp) recommends that to be able to visualize bands between 25-50 bp, you should add 1.8 ug, or 1800 ng, into the well in order to visualize the bands. In the case of the marker they recommend 5 ul.
Miniprep
As a result of our plasmid DNA miniprep we obtained 30ng/ul concentration. For the restriction reaction we used 500ng of plasmid DNA, therefore 20 ul of the miniprep.
The digestion final volume was 50 ul. From here we took 20 ul to load into a gel. This means that the real quantity of DNA that we loaded into the gel was 240 ng.
For this reason it is possible that there wasn't enough DNA (1800ng vs. 240 ng) to be able to see the bands.
"The digestion occurred but we weren't able to see the small DNA bands"
|
|
|
|
|
| |||||||||||||||||||||||||||||||||||||||||||||||||||||||||||||||||||||||||||||||||||||||||||||||||||||||||||||||||||||||||||||||||||||||||||||||||||||||||||||||||||||||||||||||||||||||||||||||||||||||||||||||||||||||||||||||||||||||||||||||||||||||||||||||||||||||||||||||||||||||||||||||||
 "
"


